Backprojection Filters


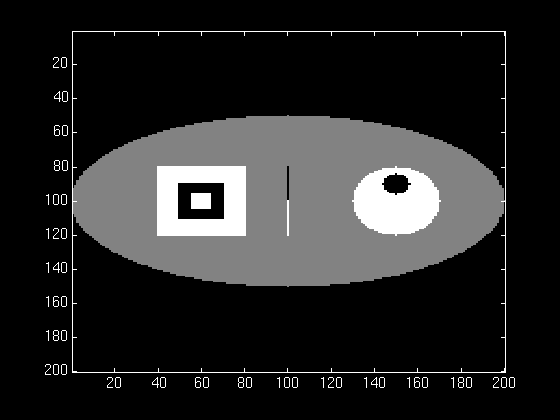
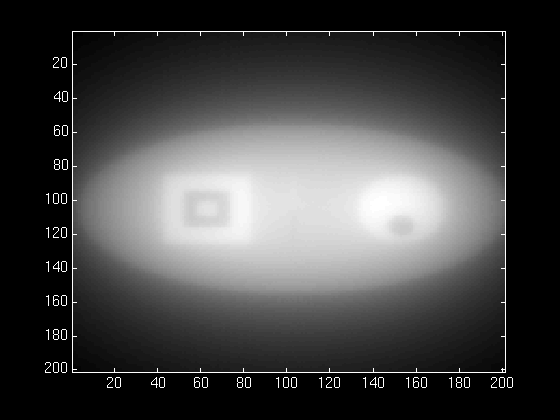
The backprojection method has several drawbacks: First, it produces an image which has a high density in the center. This is due to the fact that many different images are being overlapped in this area. Secondly, the resulting image is severely blurred, as shown in the figures below. The first figure shows a phantom before taking projections. The second figure shows the unfiltered backprojection reconstruction of the phantom. This effect comes from the overlapping of the Fourier-transformed images around the low frequency region. To control these effects, it is clear that a filter is needed during reconstruction of the projections.
By means of a precise mathematical treatment, it can be shown that to reproduce the image exactly, it is necessary to use a ramp filter. In the frequency domain, this filter is just |w|. The corresponding inverse Fourier transform is a wavelet pattern.
The figures below illustrate the effect of using a simple ramp filter. The first figure shows the normalized magnitude response of the ramp filter and the second figure shows the reconstructed phantom using the filter.
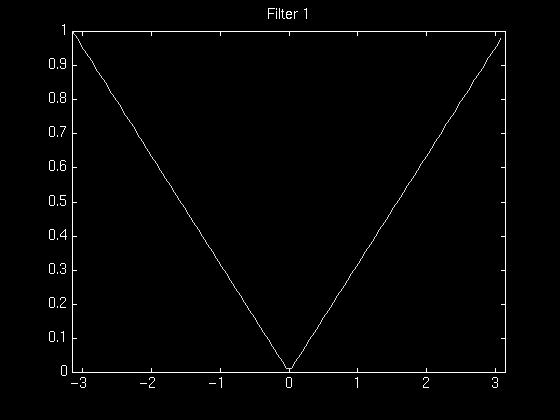
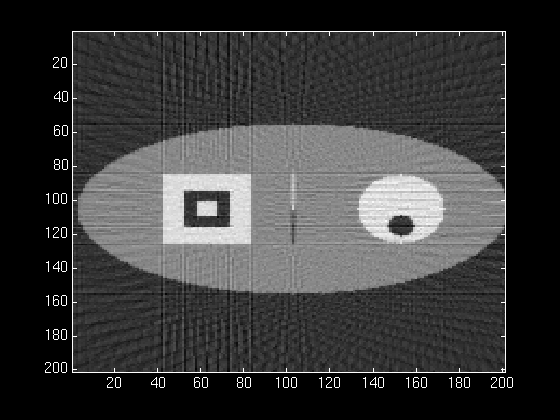
This filter has the effect of filtering out low frequencies and passing high frequencies, with a linear behavior in between. Thus with this filter, contrasting features (high-frequencies) are accentuated, while blurring (low-freqencies) is minimized.

The Ideal Ramp Filter works very well for reconstructing projections, but has the undesirable effect of passing and magnifying extraneous noise from projection data. This is an important point for our application, because the projections are indeed subject to noise.
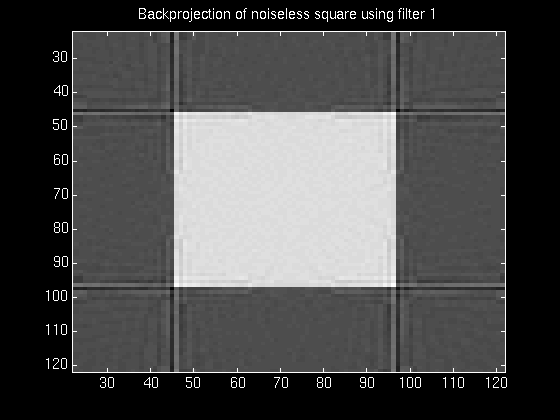
The figures below show the reconstruction from projections of a simple square, using the simple ramp filter during reconstruction. The first one shows the reconstruction from noisefree projections (taken at 60 projections), and the second shows the resulting reconstruction when 1% random noise was added to the projections of the square.
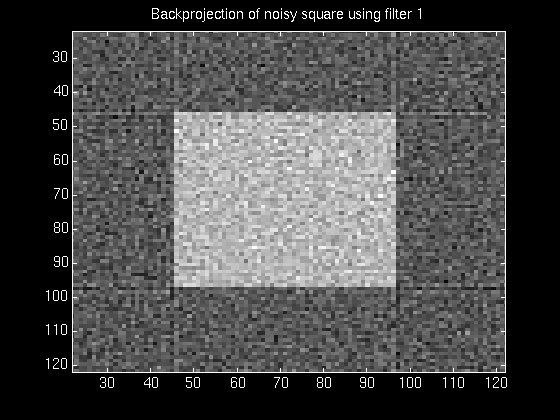
For this reason, we experimented with several modified filters, reducing the high-frequency cutoffs to a different degree in each case, so as to filter out the noise. Unfortunately, these filters had the unwanted effect of smoothing out definitions.
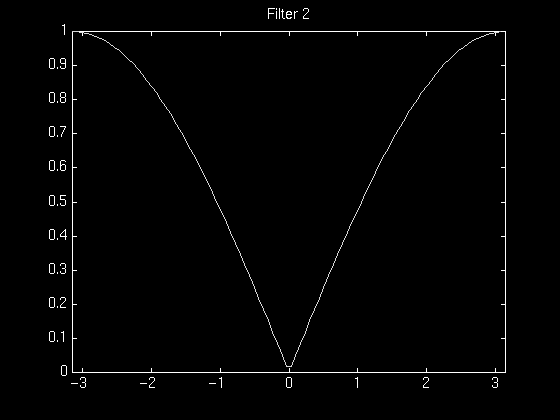
The following series of figures illustrates this tradeoff. The figures on the left show the normalized magnitude response of the filter used in each case, and the figures on the right show the resulting reconstruction using that filter.
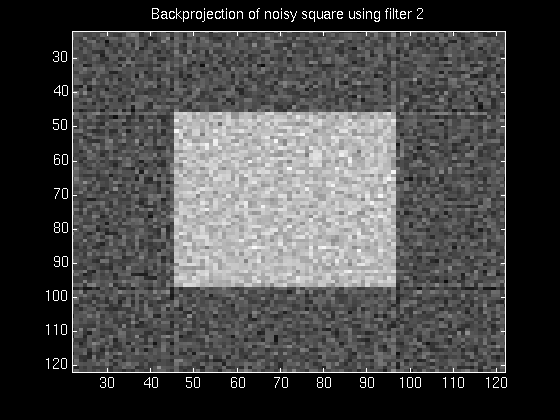
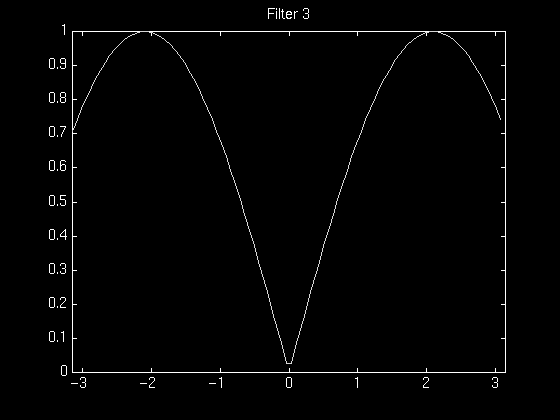
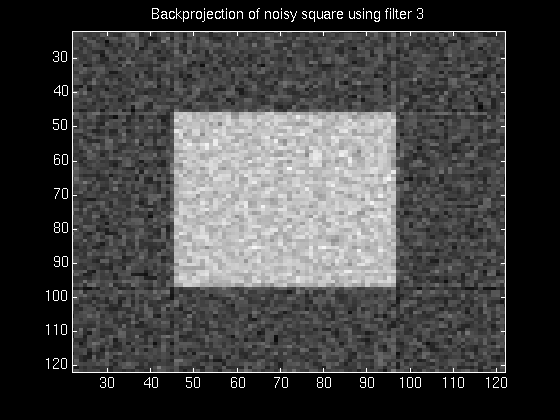
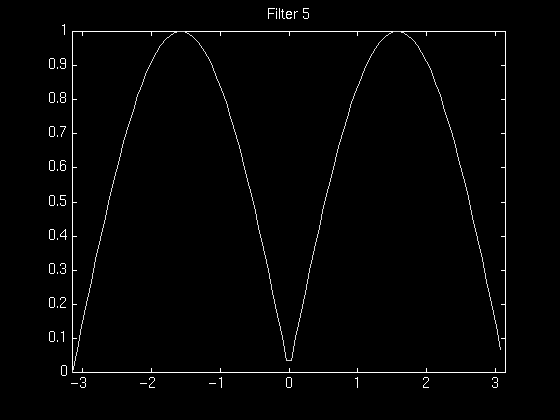
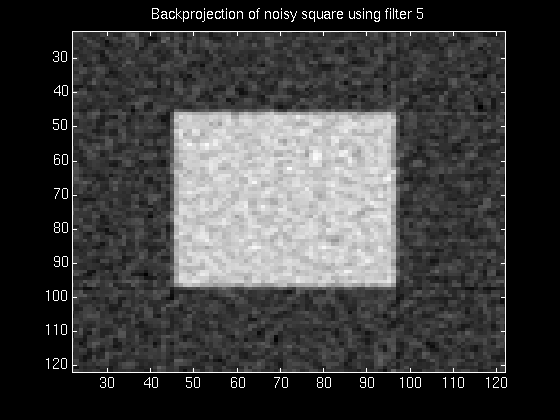
It was found that most of the experimental filters worked reasonably well for images that had a relatively less complex frequency distribution. For images containing a high degree of complexity, the best tradeoff between noise removal and feature preservation did not improve the image much.
The following series of figures illustrates this problem. The first figure below shows the original phantom used, and the second figure shows its reconstruction from noiseless projections using the simple ramp filter.
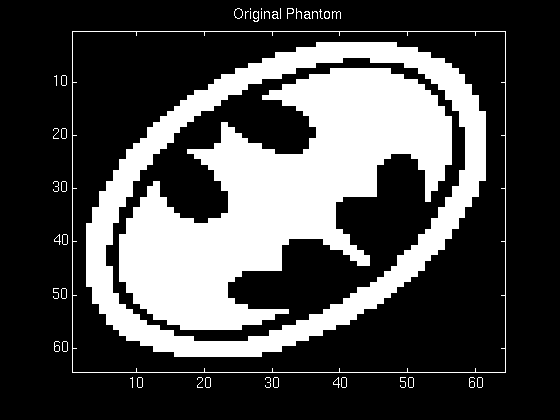
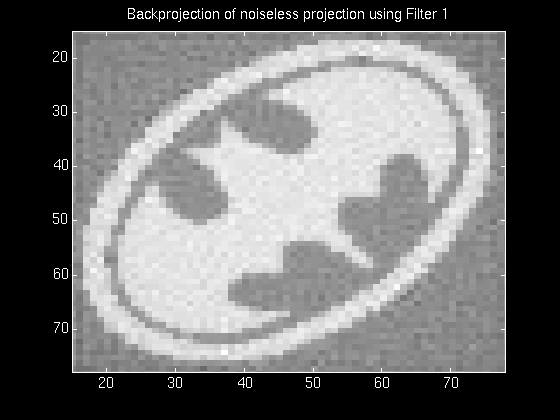
The figures that follow show the series of changes experienced by the reconstructed image from noisy projections, as the filter function is varied. The projections of the image above were exposed to 0.1% random noise.The figures on the left show the normalized magnitude response of the filter used in each case, and the figures on the right show the resulting reconstruction using that filter.

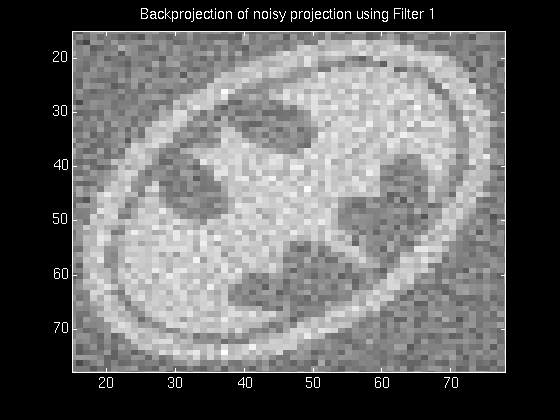

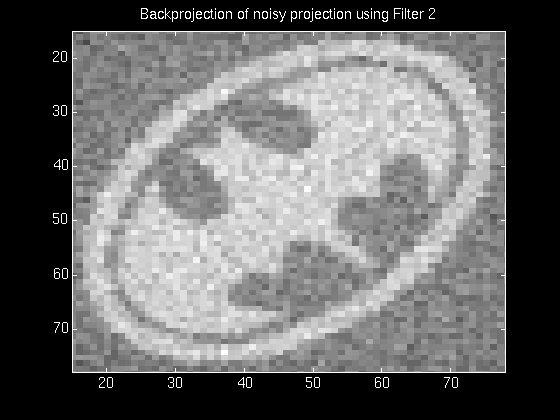

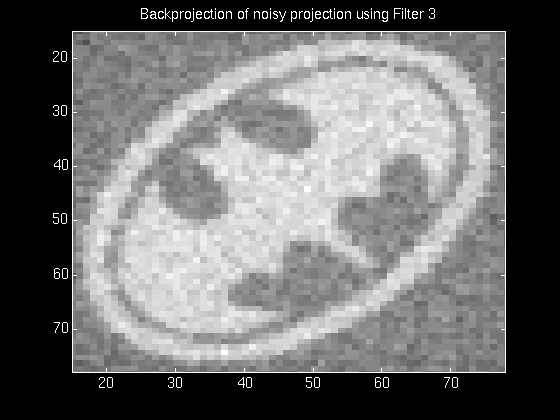
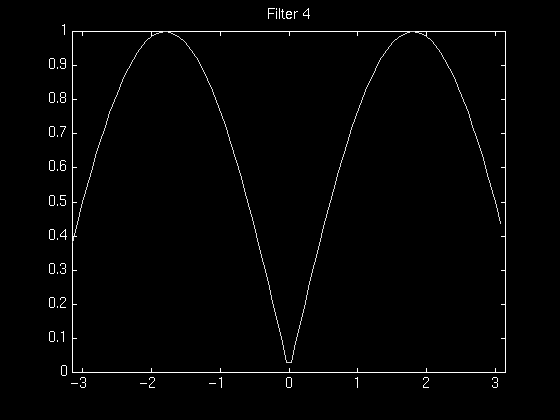
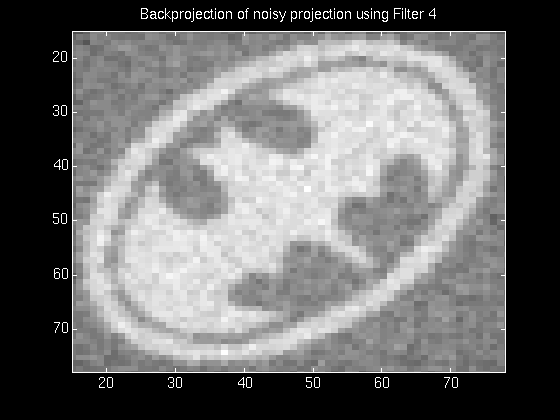

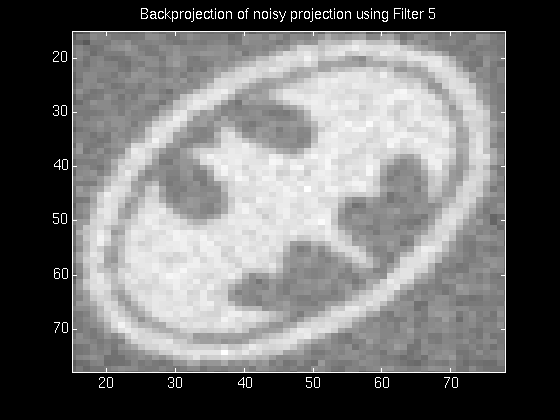
As can be seen from the above figures, as the high-frequency cutoff is decreased, the image becomes smoother and the edges become less prominent. A perfect filter is thus quite difficult to construct without prior knowledge of the type of noise that plagues the projection data.
The Matlab code for the sinc filters used above can be found here.

| On to the next page... | Back to the front page. |