
|
|
Comp202: Principles of Object-Oriented Programming II
|
This tutorial covers linear equations for plotting numbers onto a JPanel and the basics of Java animation to animate various sorting algorithms.
Click on this link to download sortAnimSrc.jar, the Java source code of a GUI application (whose main program is SortCtrl.java) that animates the various sorting algorithms discussed in the above. To extract the jar file, enter the command:
jar -xfv sortAnimSrc.jar
Click on this link to download the class files for two demo programs: SortCtrl and SortControl. You can also run the binary class files as follows:
If you are using Windows, change the colon (:) in the above commands to semi-colon (;).
The above code can be found in the following DrJava project: lab12.zip
Play around with this program to see how it behaves. The program is designed according to the MVC pattern as shown in the UML diagram below.
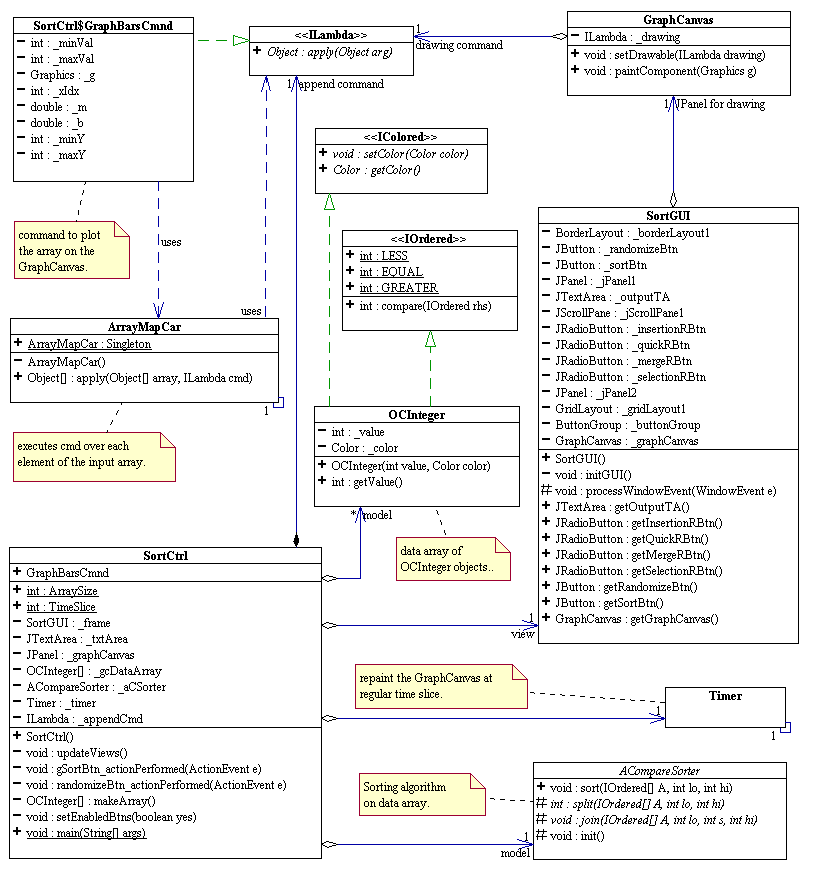
In the above diagram, the model is an array of OCInteger objects that is to be sorted according to a concrete ACompareSorter selected at runtime. SortGUI is the view. It has a GraphCanvas where the data array is plotted and animated via an inner object of SortCtrl, the controller: SortCntrl.GraphBarsCmnd. It makes uses of ArrayMapCar to plot each element in the data array on the GraphCanvas. SortCtrl also has a concrete ILambda to print the data array on the JTextArea of SortGUI. ILambda has one method called Object apply(Object arg). It represents the abstraction of a command that is capable of performing a task given an input and returning an output object. GraphCanvas delegates the task of drawing to its ILambda object. Similarly, SortCtrl delegates the task for updating the text area to print the data array to another ILambda inner object called _appendCmd. SortCntrl.GraphBarsCmnd and _appendCmd define what to display on the view SortGUI. But they only appear to SortCtrl as ILambda objects. SortCtrl asks these ILambda objects to carry out their tasks (by calling apply) without knowing what the tasks are. These are simple examples of what is called the Command Pattern.
SortCtrl holds a Timer object that periodically tells the GraphCanvas to repaint. SortCtrl.GraphCmnd defines what to draw. The Timer object dictates when to draw.
NOTE: ArrayMapCar can be (and should be) implemented as an ILambda. Think about it whenever you get excited about OOP. we may ask you how to do it in the take-home final.
We want to plot an array of integers on a JPanel as rectangular bars with appropriate heights and widths. The graphics method to use here is Graphics.fillRect (int x, int y, int width, int height). It is important to first understand the orientation of the x-y coordinate system in Java graphics. As in most graphics systems, the x-coordinate of the graphics context of the JPanel extends form left to right, while the y-coordinate extends from top to bottom. The origin of the coordinate system is at the upper left corner of the bounding rectangle.
To have a "nice" plotting of a number A[i] on a JPanel, we use the simple transformation y = m * A[i] + b to map A[i] to the plane of the JPanel. Let maxVal be the maximum value in the given integer array, and let minVal be the minimum value in the given array. Plugging maxVal and minVal into the equation y = m * A[i]+ b, we get
We arbitrarily assign a value to maxY and minY, and then solve for m (the slope) and b (the y-intercept). We now use the equation y = m*A[i] +b for all element A[i] in the given array. We can think of the index i as an x-coordinate, and y = m * A[i] + b as its y-coordinate.
Exercises:
In the constructor SortCtrl(), modify the code to load GraphDotsCmd
instead of GraphBarsCmnd.
Recompile and run the program to see the effect.
Last Revised Thursday, 03-Jun-2010 09:52:24 CDT
©2006 Stephen Wong and Dung Nguyen