Lab 3 - Debugging
Lab goals:
- Practice using Git for collaboration on code development.
- Understand some important ideas about debugging.
- Practice using gdb, the most widely used debugger on Unix/Linux systems.
Collaboration using Git
Before looking at debugging, the main topic of this lab, we will first look in more detail at Git, which you have been using in the labs and assignments in this course. Git is a powerful tool to enable collaboration between developers. Features like branches allow developers to concurrently develop new features or experiment without concerns about breaking the source code. Navigating collaboration with Git can be confusing and can cause issues like merge conflicts. Although previous assignments have been done independently, other assignments such as the Linking assignment will allow students to work in pairs, so the following use cases and exercise will prepare you to use collaboration in Git.
Imagine that the next assignment asks you and your partner to write a program named example.c.
Use Case #1: Nonconcurrent Changes
Consider the case in which either you or your partner (e.g., Person 1 and Person 2) makes changes to example.c by modifying functions, adding lines of code, comments, etc., while the other person has not made any changes. Once your changes to the code are pushed to the remote repo with git push (make sure changes have been added and committed first), the remote repo’s example.c file will include all of the most recent edits to example.c. Then, the partner who did not make any changes could pull the remote repo code with git pull, which will update their local repo with the updates from the remote repo. There are no merge conflicts in this scenario because the person pulling the code hasn’t made any edits to their local repo that would conflict with the version of the remote repo that they are about to download.
Use Case #2: Non-Conflicting Concurrent Changes
Now consider, instead, the case in which both you and your partner are modifying different parts of example.c: Person 1 adds a function to the bottom of the file and Person 2 declares a struct near the top of the file. To integrate both people’s changes into the remote repo, one person will push their updates, and the other person will pull and then push their changes. Failing to do the pull first will cause your push to fail, because the other person does not have the most recent copy of the code before pushing their changes. On the pull, their changes are integrated automatically because they modified different parts of the file.
Use Case #3: Conflicting Concurrent Changes
Suppose, instead, that Person 1 and Person 2
concurrently modify the same (or overlapping) part
of the file. For example, Person 1 adds a comment
saying Partner 1 (pa1) and Partner 2
(pa2)
to the file, and commits and pushes this
change to the remote repo. Person 2 adds a comment
saying PARTNER 1 (PA1) and PARTNER 2
(PA2)
, at the same location as person 1’s
comment (note the different capitalization) Now suppose
Person 2 commits this change to their local repo and
then attempts to pull person 1’s changes from the
remote repo. This creates a merge conflict for
person 2 because both people have committed different
changes to the same part of the file. Person 2 will
see a message such as shown below:
          Auto-merging example.c
          CONFLICT (content): Merge conflict in example.c
          Automatic merge failed; fix conflicts and then commit the result.
If Person 2 then looks at the contents of the
example.c file, the portion of the file around
where the change was made will look like:
          <<<<<<< HEAD
           * PARTNER 1 (PA1) AND PARTNER 2 (PA2)
          =======
           * Partner 1 (pa1) and Partner 2 (pa2)
          >>>>>>> fb8b05994087324930d57f0alea0af425cd08d9d
If, instead, you are using something like VS Code to interface to Git, you may see something like:
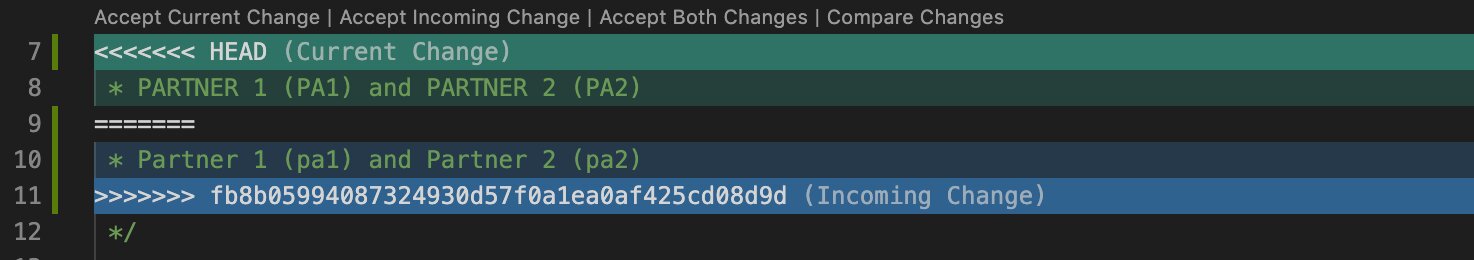
Person 2’s commit is shown between the
<<<<<<< and
======= lines, and person 1’s
commit is shown between the
======= and
>>>>>>> lines To
resolve this merge conflict, person 2 can manually
modify the parts of the code they want to keep or delete.
They should also delete the
<<<<<<<,
=======, and
>>>>>>> lines
themselves. In other words, make that part of the file
around the conflict now look just the way you want it to.
Now, the merge conflict is resolved and person 2 can
re-commit their code and push it to the remote repo.
Use Case #4: Using Git Branches
Finally, consider the case in which you want to make a
possibly large set of changes and want to work on them for
a time independently from other changes to the repo being
made by your partner. When a Git repo is created, GitHub
automatically creates a default branch called
or
main
. A branch is a
version of the code with its own commit history. This makes
branches the best choice for doing big new development or
experimental features because they allow you to develop
without worrying about interfering with other concurrent
changes to the code. In this class, using branches to
develop your code will generally be overkill, but it may,
for example, be especially useful in the Malloc assignment
when you are testing a new approach or optimization.master
Using Git in VSCode
VSCode has a built-in Git integration that can be used to perform many of the Git commands you have been using in the command line. To access the Git tools in VSCode, you can click on the Git icon in the left sidebar. This will open the Git tools in the left sidebar. The Git tools include a list of files that have been changed, a list of files that have been staged, and a list of commits. You can click on the file names to see the changes that have been made to the file. You can also click on the commit messages to see the changes that were made in that commit. You can also click on the plus icon next to the file name to stage the file. Once you have staged all of the files you want to commit, you can click on the checkmark icon to commit the changes. You will be prompted to enter a commit message. Once you have entered a commit message, you can click on the checkmark icon to commit the changes. You can also click on the three dots icon to access more Git commands, such as pushing and pulling.
You can find more information on using Git in VSCode here
Tracking Files in Git
Do not blindly check in every file in your local directory to git.
You should only be adding/committing source files that you yourself write. A general rule of thumb is that if the file was generated automatically (say, by the compiler), you should not commit it to git. If you need those generated files later, you can regenerate them from the source code. In particular, do not check in executables, .o files, or other generated files to your git repositories. These files consume space, are largely useless to others using your repository (compiled files may not necessarily work on the machine someone else is using so they will likely recompile the source anyway), and create unnecessary conflicts and updates when others compile the code.
Debugging Overview
Debugging is something you'd rather not need to do. It means you made mistakes when first coding that now need to be fixed. You'll save yourself time and stress if you don't make the mistakes in the first place.
Debugging includes the following steps:
- Detecting an error, e.g., through testing.
- Reproducing the error. Errors that can't be reproduced consistently are almost impossible to diagnose. Common causes of irreproducibility include improper initialization, improper dependencies on memory layout, use of randomization, and incorrect synchronization of multiple threads.
- Finding and identifying the mistake causing the error. This is usually the hardest part. This lab concentrates on this step, referred to as debugging.
- Fixing the mistake and testing the fix.
- Looking for similar and related mistakes.
Debugging is, in general, very difficult. It requires practice to become proficient at debugging.
Avoid Making Mistakes
Debugging
actually begins when you are writing
your code, rather than after you finish a first draft. You
should always proofread your code before compiling it.
The earlier you find and fix a bug, the
better. It takes less time to identify and fix the
problem when the code and its purpose are fresh in your
mind. And in a real-world business environment, identifying
and fixing problems later delays other aspects of
development (such as quality assurance and writing of the
user manual).
Look for Common Mistakes
From experience, you should realize that some mistakes are more common than others. Some have been discussed in class. When coding, testing, and debugging, you should keep these in mind. These common mistakes include the following examples (see also Expert C Programming: Deep C Secrets by Peter Van Der Linden, Prentice Hall, 1994):
- Syntax errors. Fortunately, these can easily be identified automatically by the compiler.
- Using the wrong variable identifier or operator. It
can be easy to confuse identifiers, especially if
poorly named. Confusing operators is common in many
languages, e.g.,
==and=in C. - Off-by-1 errors, including using the wrong comparison operations such as < instead of <=.
- Failing to initialize a variable before using it.
- Allocating data on the stack when it can be accessed after the local function returns.
Be sure to use the pickiest compiler warning level possible! As we've previously indicated for this course, that means using cc's flags -Wall -Wextra -Werror.
Test Your Code During Development
We could spend weeks talking about testing. You've already been required to be somewhat systematic about testing. An important idea about testing is to get small parts of the program working correctly first. As you implement each function in your program, you can write small test functions (sometimes referred to as unit tests) to test that function alone. This way when you implement the next function, and your program passes all tests, you can be confident that you have not broken any of the previously written functions (this is also called regression testing). Each function must be tested against all valid inputs. A simple idea here is to divide your inputs into different categories and to sample each category in your test cases. But also make sure you cover all corner cases in your testing. You've probably also done whole-program testing on an ad hoc basis before, whereas our grading in this class uses an automated whole-program tester.
To be worthwhile, use the tests. Test frequently, and debug immediately. To this end, automate testing. That's what you've done with unit testing in this and previous courses. That's what we do with whole-program testing when grading.
Trace Debugging
The idea of trace debugging is simple: print out messages and values during program execution, so that you can trace some of the program's behavior. Then you can decide if this is the intended behavior. Basically, you are collecting evidence that will help you converge to a theory of what may be going wrong with your program's execution and what may be the cause of it.
The primary strength of trace debugging is the
ability to narrow the potential scope of the
problem — for example, to move from there's a
bug somewhere
to something like function
foo() isn't calculating the right
result.
printf-Style
Trace Debugging
printf-StyleYou can add printf (or other print-type
statements) to your code to help you better see what is
going on as the program executes and to better see where
possible bugs may be.
Where should you add print statements for debugging? Here are some suggestions:
- At the beginning and end of important functions (or even all functions). Print out arguments and return values. This is by far the most common use.
- After complicated computations. Print out the results.
- In loops, possibly at both the beginning and end of each iteration of the loop. Print out the loop index or other changing values and the results of any computation in each iteration of the loop.
These print statements create a trace of the program's execution. With even small programs, traces can sometimes have too much information to be immediately understood. To collect all of this information and examine it more easily, you can redirect this output to a file using I/O redirection (as discussed in the previous lab). To reduce the amount of information in such a trace, you can make some of this output conditional on one or more debugging flags and/or an integer representing levels of debugging verbosity. For example:
    int debug_level = 2;

    if (debug_level > 1) {
            /* Print basic debug messages. */
            ....
    }

    if (debug_level > 2) {
            /* Print more detailed debug messages. */
            ....
    }
Adding Assertions
A variant on the theme of printf-style
trace debugging as described above is to check for
unexpected conditions at relevant places in your code and
to just print something and exit the program if something
unexpected occurs. This type of debugging check is usually
called an assertion, as you assert in the code
that some condition (the assertion)
should hold, and the assertion fails if it does
not. Assertions are usually distinct from the normal
error-checking in your program — error-checking looks for
expected
mistakes such as bad user input, while
assertions look for unexpected
mistakes such as a
programmer calling a function with improper arguments.
Assertions are a common programming technique in any language. They can, and should, be used in conjunction with the other debugging and testing techniques. They are placed within your code, not separated like unit tests.
The standard C library provides a convenient mechanism for adding assertions in your code:
     #include <assert.h>

     assert(condition);
If the asserted condition is true, as expected,
nothing happens. However, if it is false, this
assert call prints an error message, including
the condition, the file name, and the line number,
and then exits the program.
For example, the first assignment starter code includes the following procedure:
     /*
      * Requires:
      *   The input "n" must be greater than 1.
      *
      * Effects:
      *   Returns the number of factors of the input "n".
      */
     unsigned int
     count_factors(unsigned int n)
     {
             /* Put your local declarations here. */

             assert(n > 1);

             /* Put your code here. */
     }
Although the specification indicates that the function
may assume n > 1, for debugging
purposes it is best to really make sure that this
assumption holds.
By default, the compiler generates code to check each
assertion. You can, however, tell the compiler not to
include the assertion-checking code by defining the C
preprocessor name NDEBUG (which stands for
no debugging
). This can be done, for example, as
follows:
cc -DNDEBUG -Wall -Wextra -Werror foo.c -o foo
The -D part here tells the compiler to define
the following C preprocessor name, and the remaining part
(NDEBUG) is the name to define (this is
equivalent to saying #define NDEBUG
at the top of your source file foo.c). In other
words, the assertion checks are included by the compiler
only if the name NDEBUG is not
defined. Yes, saying only if ‘no debugging’ is
not defined
is a double negative! Sorry about
that, but that's how assert() works.
Debuggers
A debugger is a program that can be used as a tool to aid you in debugging another program. With a debugger, you can see what's happening in your program by stepping through the program's instructions while its running and looking at the changes in your program's variables. Additionally, you will often want to quickly skip though large portions of your program without always single-stepping through the whole thing. As such, the four typical, basic operations of any debugger are to
- single-step, or execute just the next line of source code,
- set a breakpoint at some place in your code,
- execute all code until the execution encounters a breakpoint, and
- print a variable's current value.
Debuggers usually have many more commands and options, most of which simply increase the usability of these basic four operations.
The primary strength of a debugger is the
ability to find the error from an already narrow
scope — for example, to move from function
to foo() isn't calculating the right resultline 14 of
or to move from
foo() is using unsigned
arithmetic instead of signed,variable
to bar somehow gets the wrong
valuevariable
bar gets the value 42
on line 78.
The most useful and most common type of debuggers, known as symbolic or source-level debuggers, allow you to debug your program relative to the program's original source code rather than to the machine code of the program produced by the compiler.
Using gdb
The most common Unix debugger is gdb, which
stands for GNU debugger
, from the GNU project. The
gdb debugger works on many Unix-like systems and supports
many programming languages, not just C. This lab covers the
highlights of using gdb (see man
gdb for full details).
In order to use any Unix debugger on some program, you
should compile the program using the
-g flag on the cc command
line to include the necessary extra source-level
information in the resulting executable program. For
example, to compile the program foo.c for
debugging with gdb, you can use the following command:
cc -g -Wall -Wextra -Werror foo.c -o foo
You can then run the gdb debugger on the resulting program foo as follows:
gdb foo
The most common gdb commands are:
breakfunction — sets a breakpoint at the beginning of the named function. The command namebreakcan be abbreviated asb, as inbfunction.runargs — starts running your program from the beginning, with the given command-line arguments, if any. The command nameruncan be abbreviated asr, as inrargs.continue— continues running the program after it has stopped at a breakpoint. The command namecontinuecan be abbreviated asc.next— executes the next program source code line, stepping over any function call. In other words, any function call is treated as a single step. The command namenextcan be abbreviated asn.step— executes the next program source code line, stepping into any function call. In other words, any function call is treated as many steps. The command namestepcan be abbreviated ass.printexpression — displays the value of the expression, which probably involves some of your program's variables. The command nameprintcan be abbreviated asp, as inpexpressionbacktrace— displays the current call stack (backtrace), so that you know where the program is currently executing and the sequence of procedure calls of how it reached that location. The command namebacktracecan be abbreviated asbt.help— displays some gdb help. The command namehelpcan be abbreviated ash.quit— exits gdb. The command namequitcan be abbreviated asq.
Using Core Files with gdb
When a program crashes
when running on
Unix/Linux, the operating system will generally cause the
creation of a core file
that records the contents of
the program's memory and certain CPU registers at the time
of the crash. Such core files can then be used by gdb as
part of debugging, in order to help you analyze the state
that the program had right at the time of the crash (at the
time that the core file was produced).
Be aware that core files can be very large, consuming a
large amount of disk space. Every time your program
crashes, it will produce a new, uniquely named core file.
That can be helpful if you want to go back and look at past
crashes, but generally, you only want to keep your most
recent core file, as the older ones are just unnecessarily
consuming disk space. And you have a limited amount of disk
space you are allowed to consume (your disk quota
),
which can easily be used up if you have a large number of
old core files. You are encourage to remove them when you
no longer need them (the rm
command was covered in last week's lab).
Also, a shell command (ulimit, if you are
using the bash shell, or limit, if
you are using the csh or tcsh shell)
can be used to configure whether or not a ore file is
created when your program crashes. CLEAR is configured to
dump
a core file by default when a program
crashes.
If you have a core file that you'd like to use in debugging why your program crashed, you simply need to execute a command such as:
gdb program corefilename
where program is the name of your program (the program that crashed) and corefilename is the name of the resulting core file (the core file that was created when the program crashed). Note that the program executable file and the source files that make it up must not have been modified since the core file itself was created.
Different systems use different naming conventions for
the dumped core files, but they will have
core
in their name somewhere (normally at
the start of the file name). On CLEAR, one way to find
the name of your most recent core file (that is, from the
most recent time your program crashed) is to use the shell
command
ls -lt core* | head
This command prints the names of the first few files
whose names start with core
, sorted with
the most recent one first.
Once you start gdb with a core file as shown above, you can then use all of the usual gdb commands, as explained above, to examine the program's state. Note, however, that you are not going to be able to do some things like step forward in the program, as the program is not actually currently running. You are simply examining the state the program had at the time it crashed and produced this core dump.
One of the most useful features of starting gdb with a core file is that gdb will tell you exactly where in your program the crash occurred. In particular, you should see an initial startup message from gdb such as
     Core was generated by `./testprog'.
     Program terminated with signal 11, Segmentation fault.
     #0  0x000000000041050b in update () at testprog.c:516
     516         *next_char = ch;
This tells you, first, the command line that was used to
run the program, and that it crashed due to a segmentation
fault (in Unix, signal 11
means segmentation
fault). Next, gdb tells you the program counter memory
address at which the crash occurred (address
0x000000000041050b), and the procedure name, source file
name, and source line number corresponding to that address
(procedure update, at source code line 516 in
the file testprog.c). And finally, it shows you
that specific line of source code.
Here, the crash occurred in assigning the value of the
variable ch into the byte in memory pointed to
by the character pointer next_char. There is
essentially only one way that this specific line of code
could cause a segmentation fault, and that is if the value
of the pointer next_char is not valid. You can
confirm this by printing its value (from the core file).
For this, use the gdb command
p next_char
(remember that the gdb
command p is an abbreviation for
print). This should look like:
     (gdb) p next_char
     $1 = 0x0
As with the use of print in the gdb exercises
above, the $1
here simply refers to the
first thing you asked to be printed (the value of
next_char) And gdb shows you that the value of
this pointer at the time of the crash was 0x0, which is the
same thing as NULL. Attempting to write into
memory at that address will always cause a segmentation
fault. So you can see here that the real cause of this
crash was that the value of the pointer
next_char is wrong. A likely explanation is that
you forgot to initialize this pointer, but it could be
other things as well. But now you know to look at your
source code to try to understand how the execution got to
this line of code with the value of next_char
being NULL Figuring out the answer to this is a
lot easier than being frustrated at the crash and having to
guess what might have gone wrong. Now you know just what to
look for in your source code!
WARNING: As noted above, core files can be quite large, taking up a lot of disk space. And your account has a quota limiting the total amount of disk space you can use. Every time your program crashes and creates a core file, it will use a new file name, and thus, it is possible to accumulate quite a few core files. It is quite easy to run out of your disk quota just by accumulating many core files. You should delete any core files when you no longer need them. Moreover, you should never commit core files to a GitHub repo! Remember, the command in Unix to delete a file is rm.
Conclusion
Between unit tests, assertions, and
printf-style debugging, you may often write as
much or more code for testing/debugging purposes as to
actually perform the desired task. Students are often
dismayed by this, as it is truly overkill for many of the
examples you will see in introductory courses. Hopefully,
you'll trust us that these techniques are worth the effort
in large projects. And using debuggers such as gdb, whether
running the program under control of the debugger or using
the debugger to help you look at the core file produced
when the program crashed, can be a very useful supplement
to these other debugging techniques.
Also, we have only touched upon these ideas, providing rather minimal discussion of them here. Commercial development tools attempt (with varying degrees of success) to minimize the amount of programmer effort needed to use these techniques.
GitHub Repository for This Lab
To obtain your private repo for this lab, follow the same steps as for the previous labs and assignments. In particular, the first step for any lab or assignment in this class is to use your browser to go to the provided link for the starter code. For this lab, that link is:
https://classroom.github.com/a/HMtTOo-R
From there, follow the same steps as for previous labs and assignments to create your repository on GitHub and to then clone it onto CLEAR. The directory for your repository for this lab will be
lab-3-debugging-name
where name is your GitHub userid.
Submission
To turn in your lab, please git push your (fixed) debug2.c file to your personal repository before 11:55 PM tonight.
NOTE: Please push only the source file debug2.c. Do not push core files or executable files (the output from the compiler).
The simplest way to ensure that you do not push too much is to use git add only on the debug2.c file, and then your commit or a push will propagate only this one source file.
WARNING: If you push core files or executable files, that will be considered an erroneous lab. In this case, you will not receive credit for the lab.