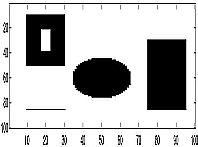
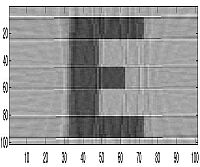
| Original Image |
|
 |
| 5 Projections |
|
 |
| 10 Projections | 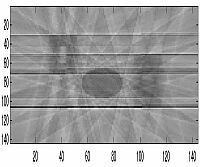 |
 |
| 30 Projections | 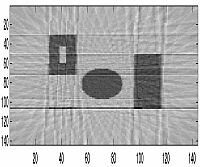 |
 |
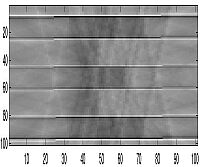
| 90 Projections | 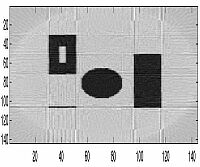 |
 |
Backprojections & First Experiment
Overview
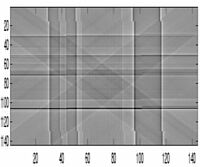
As we described in the introduction and during our discussion on the mathematical theory behind tomography, backprojection is the technique that allows us to reconstruct our image from the filtered projections we calculated from an original image. Backprojection can be thought of as "smearing" all of the projections across a 2-D plane, and looking to see where the different projections overlapped each other the most - in these spots the intensity will be the highest and you will be able to see the shape of the original image - or that is what is hoped.
Now, will we be able to see the original image? This question depends heavily on the projections taken. Remember that we took N number of projections from N different angles. We have reason to believe that the larger the value of N is the better chance we have of reconstructing our original image.
Experiment
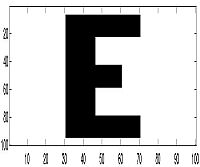
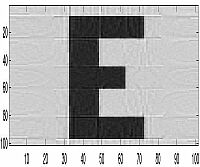
Our initial experiment was to figure out how many different angles we must "smear" from in order to recreate the original image. Our experiments were primarily conducted on 2 different images we created in MATLAB, although we performed tests on a variety of images and shapes. We created one which consisted of two squares (one with a hole in it) and a very thin horizontal line and a second one which is the letter "E." Our MATLAB code took two arguments, the image and the number of projections. The angle at which those projections were taken at were equally spaced from 0 to 180 degrees (0 to pi). We realized that it is only necessary to do it from 0 to 180 because a projection at 0 is the same as one at 180 and a projection at 1 is the same as one at 181 and so on. The projections in this part of our research were filtered with a ramp filter with a low cutoff frequency so as to eliminate excess noise that would be amplified otherwise.
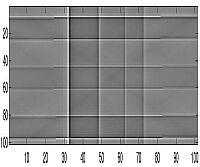
For the letter "E," we could begin to see the image at about 4 projections but we feel that familiarity with the image enabled us to see the image before others could completely recognize it. Also, because this image was created from a few simple rectangles, this allowed the image to be seen after just a few projections because of the nature of the reconstruction through backprojection. But for other images we were able to actually see them at roughly the 8th or 9th projection. This would mean that a projection is taken at roughly every 20 degrees around the object. However, the image becomes much more clear the greater the number of samples - as can be seen in the images below of 90 projections. For our other image, we decided to put the thin horizontal line along the horizontal axis of the bottom square to see if the smearing process would cover the line and make it undetectable in the reproduced image. As can be seen, the line is very hard to detect unless if a relatively large number of projections are taken.
Results
| Original Image |
|
|
| 5 Projections |
|
|
| 10 Projections | |
|
| 30 Projections | |
|
| 90 Projections | |
|
<< previous page || next page >>