![]()
![]()
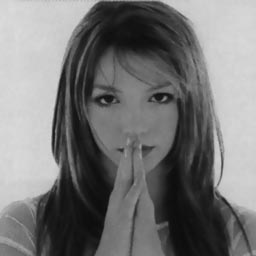
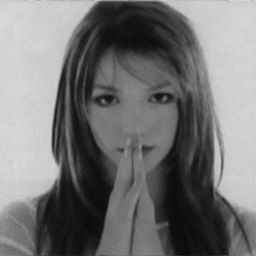
Encoding the image with hidden data only slightly reduces the quality of the image. Notice how the picture on the right is slightly more blurry. This is because the middle frequency information of the picture has been stripped and replaced with encoded text. It is optimal to use the midband frequencies when employing steganographic techniques because low frequency information is vital to the picture's overall appearance, and high frequency information is susceptible to loss such as in JPEG compression.
 |
 |
|
|
|
When we take the FFT of the altered image, a visible ring around the middle frequencies is apparent. Note the thickness of the ring. Had there been more encoded data embedded in the image, the ring would have been much darker. Our steganography detection method is adaptable to various levels of sensitivity via its changeable threshold for tolerable discontinuities.
- color.jpg) |
- color.jpg) |
|
|
|
Applying our LabVIEW code to 3 different sets of images, we could easily identify the images with embedded data by the percentage of slices that contained discontinuities. The threshold level for tolerable discontinuties was set at 10%.
|
|
|
|
|
|
|
|
|
|
 |
|
 |
|
 |
|
 |
|
 |
|
 |
|