| |
|
|

Results
Classification Tool:
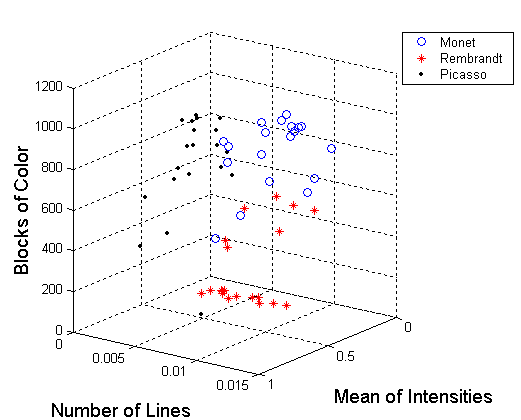
In combining the tools, each tool was considered as operating in a certain dimension of space. The data then from each tool classified the art in some point of this “classification space.”
Utilizing all five tools would have given a five dimensional space. However, certain tools were more accurate than others in distinguishing artists, and the algorithm was built upon the three most successful classifiers.
The first successful tool was the intensity analysis tool, which clearly separated Rembrandt from the other two. The second effective tool was the edge detection tool, which picked out Monet from Picasso. These two tools alone make a very accurate classifier, but, to add more certainty, the blocks of color tool was incorporated.
Final Results:
Below is the result of plotting sixty data tests in a three dimensional space created by combining the algorithms. While each artist’s space is not completely separate from the other two (see failed pictures at the bottom of page), there is a definite distinction between Monet, Rembrandt, and Picasso that can easily be utilized to distinguish the creator of the painting.

The confusion charts for all 120 tests:


Conclusion:
Though the three selected artists had clear styles, easily distinguishable by the human eye, building an algorithm proved more difficult. How does an impression, a fleeting glimpse of summer rays, or lines slicing through colored space translate into zeros and ones?
The basic strategy in tool development was translating human analysis into numbers. What does it mean for a picture to be colorful or to be blocky?
Using the tools already made available via MATLAB make this project possible. Most of the MATLAB code, except for similar block color analysis, is trivial.
In testing, data had to be normalized to produce any meaningful results. Perceived trends also broke down quickly when more test cases were applied.
The final classification strategy incorporated only three tools. However, a more advanced classification strategy could be implemented by using data from the two other tools. For example, if tools gave conflicting artists, the classification tool would make a smart guess by weighting each tool’s suggestion.
Further development of the project would be to develop more tools for painting analysis. With higher dimensional classification spaces, more artists could be separated from each other.
Finally, this project revealed a few defining characteristics of research:
- Though unpaved, the road most often has been tread by some. Both their failures and triumphs are invaluable.
- Dead ends are almost certain, but the key is to keep on going. Two tools were completely discarded halfway through overall development.
- Ingenuity and resourcefulness oil the gears when they get stuck.
Acknowledgments:
Dr. Rich Barniuk
Mr. Mike Wakin
www.mathworks.com
www.artchive.com
arthistory.about.com
www.freelayouts.com
 See what pictures failed See what pictures failed 

|
|
|


