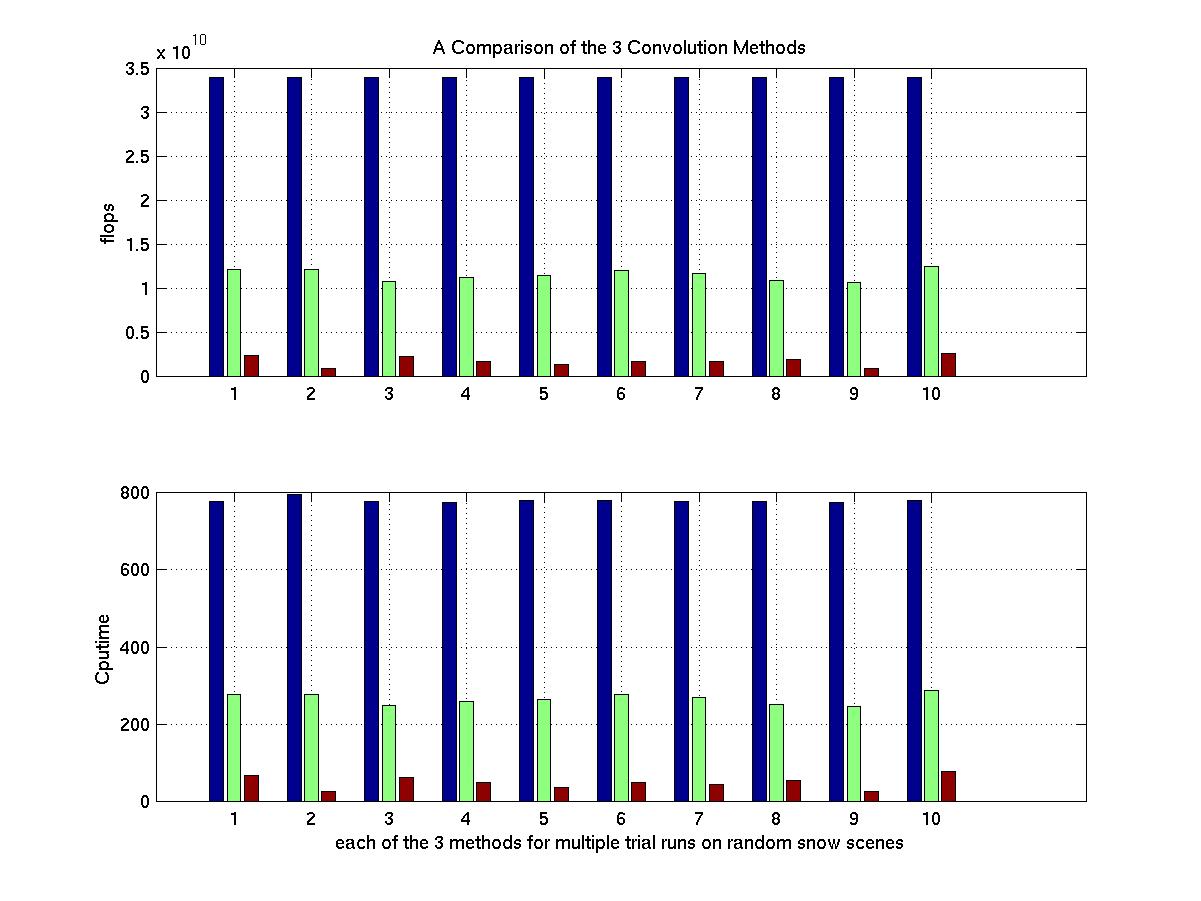
Method Comparison Graphs
Blue = naive convolution
Green = convolution with white space optimization
Red = convolution with gait and white space optimization
Analysis appears on the
final report.