

Check out the class homepage at http://www-ece.rice.edu/~richb/elec431.html
Our project was to develop a speaker identification system on SGI Indys using Matlab. The planned system would listen to the speaker's voice, and decide the identity of the speaker. In the process of implementing the system, we had to answer several questions:
The final system we implemented, takes a 2 second voice sample (the vowel "A"), analyzes the frequency components, and make a decision based on a predetermined set of criteria. The system only attempts to identify the four group members, while strangers should not be positively IDed.
Due to the sampled nature of our data, we are inherently windowing our signal. Furthermore, we then chop out the middle second of the data to remove any start and stop transients. This is exactly like windowing our signal with a box window, the worst possible window-type. The box-window in the time domain is a sinc in the frequency domain, and effectively smears the data. This widens peaks, and deemphasizes features of the frequency spectrum as shown in the first graph.
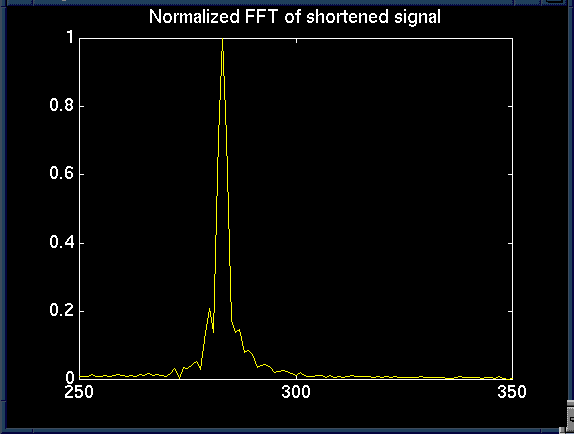
To compensate for this effect, we chose to multiply our data by a nicer window to try to lessen the smearing effect. First, we investigated many window types such as Blackman, Hanning, Hamming, and many others. Some windows more effectively sharpened peaks, while others lessened sidelobes.
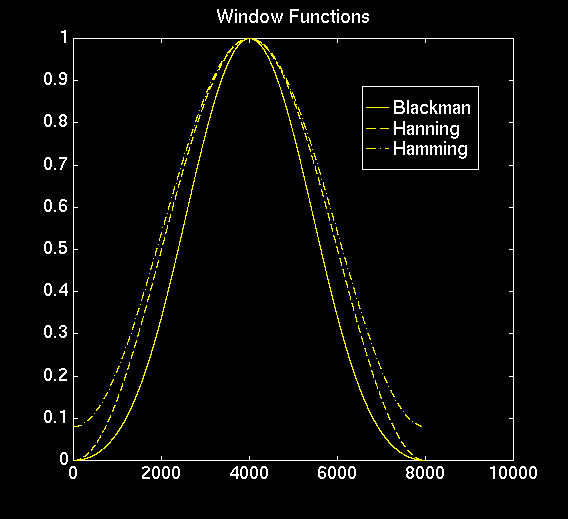
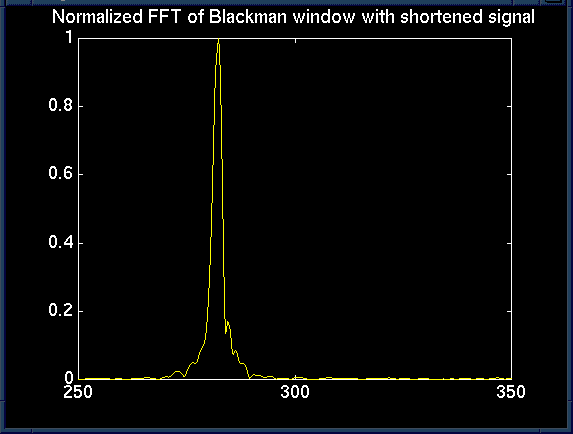
We finally settled on a Blackman window, but many had relatively the same effect. The Blackman window is a good compromise in that in both sharpens peaks and reduces sidelobes. Since our project dealt with correctly identifying peaks and their magnitudes, we felt this was a good choice.
One of the first functions we wrote was a C mex function for recording audio on an SGI. Matlab already has support for playing audio, but the only way to input audio is by reading sun mu-law files with the auread() command.
The record function allows the user to directly sample audio into matlab at any supported bit or sample rate. In addition to the convenience of not having to convert/import data from files, recording directly into matlab overcomes the 8-bit mu-law limitation. For example, for our project, we sampled at 16-bit 8000Hz.
In addition, the function waits for the signal to surpass an preset threshold value. This allows your matlab program to wait for audio input before progressing. The record function, with source and compiled mex file are also available here as record.tar.gz
Another necessary function locates the local maxima of a data series. In our analysis, we require the isolation of peaks of a frequency spectrum for comparison. The C mex function peak2 attempts to extract the local maxima from a set of data. The matlab function peak then extracts frequency-independent information original signal. peak() calls peak2() to locate the first major peak. It then checks the data at the harmonic multiples of this original frequency. peak() returns the magnitude of each one of these peaks.
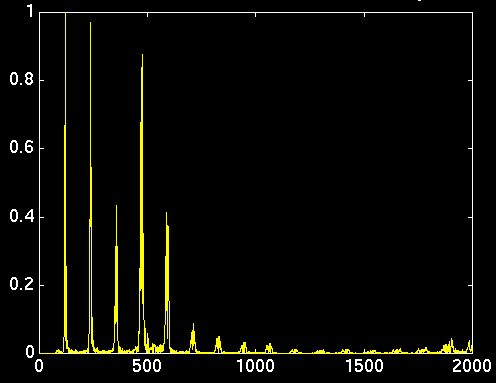 Typical Voice Spectrum
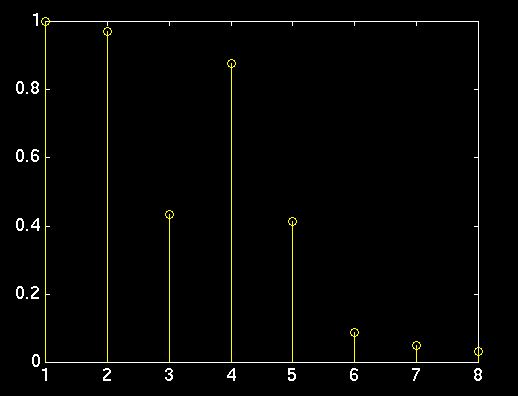 Peak() Analyzed
As you can see, the peak() analyzed version removes all frequency dependence, and leaves you with just the number of peaks, and their magnitude. This allows us to compare voices at any pitch, as long as your actual "voice" stays relatively constant.
Both of these functions are available with source and compiled mex file in peak.tar.gz
Main program
The main source for our program is available as test.m Also, loadvoice.m must be run prior to test to correctly load all voice responses.
what we looked for
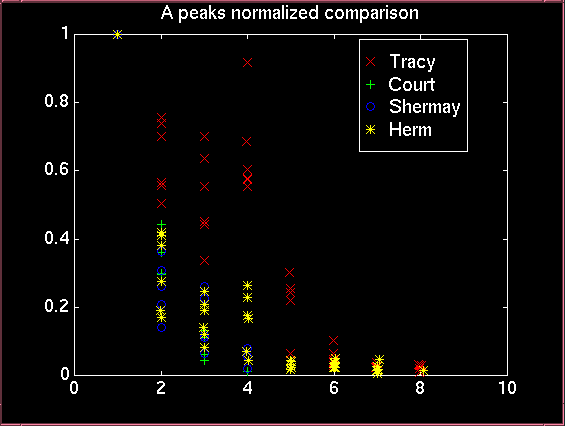
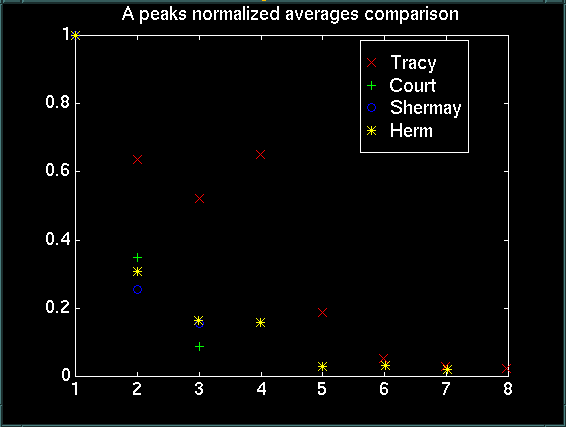
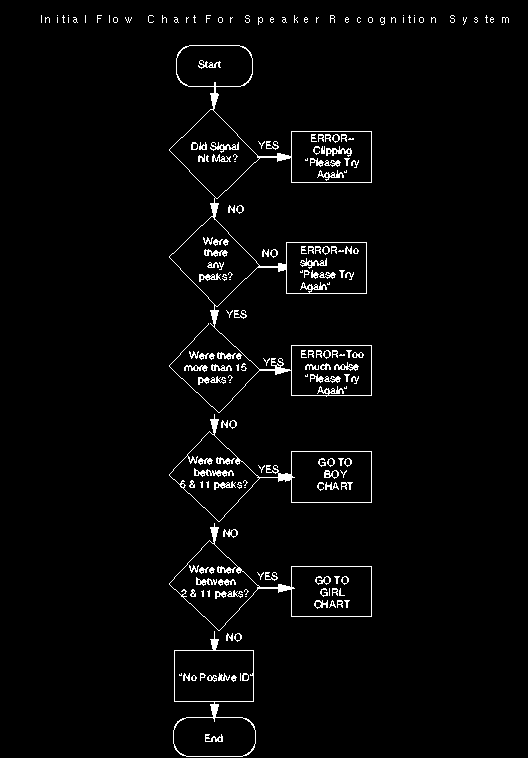
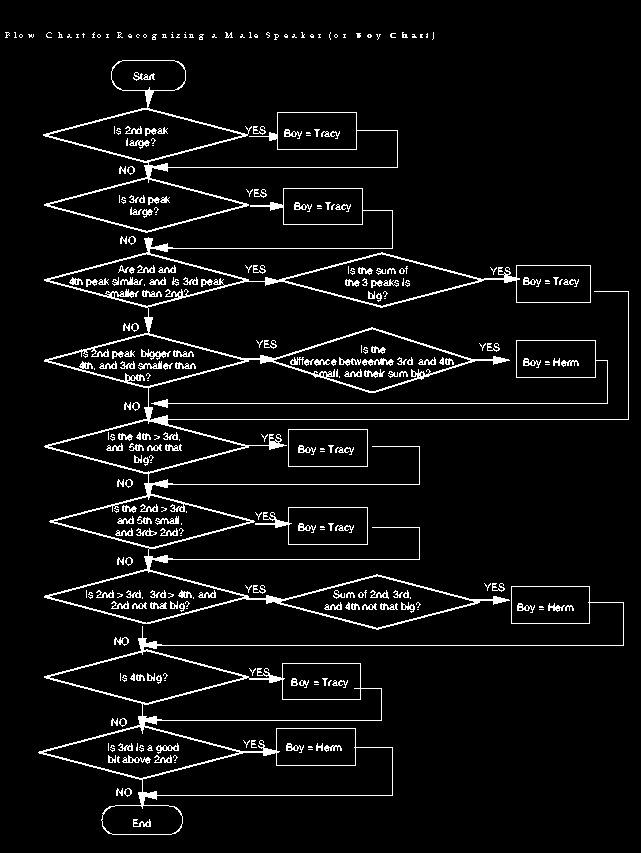
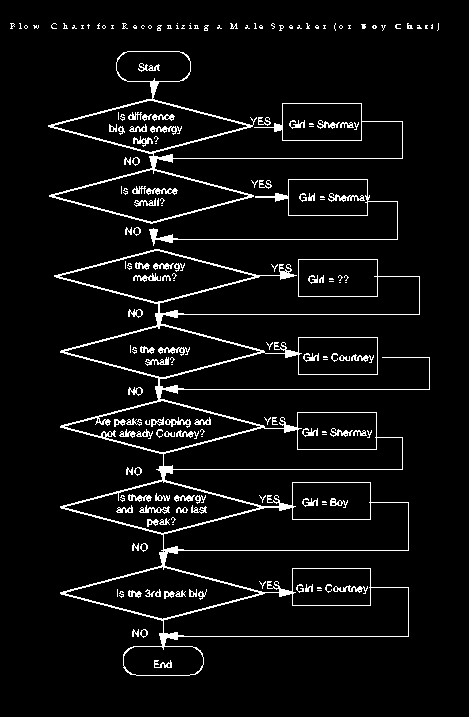
You can download these three flowcharts in postscript form as charts.tar.gz
To evaluate the performance of our system, we ran many trials (ask our classmates). We wanted to minimize both false-identifications, as well as no-positive-identifications, although we definitely preferred the later. After gaining confidence in our system, we had each member run 25 trails of the system and record the results:
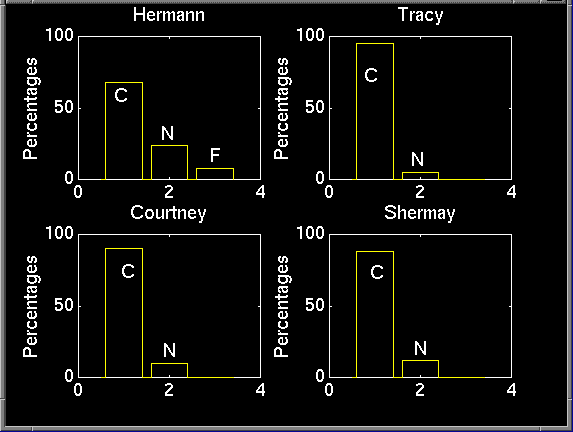
As you can see, the system performed reasonably well. Hermann was the only one able to register a false-identification, and the other had only a few no-positive-identifications. Combining all these results, the system was correct approximately 85% of the time:
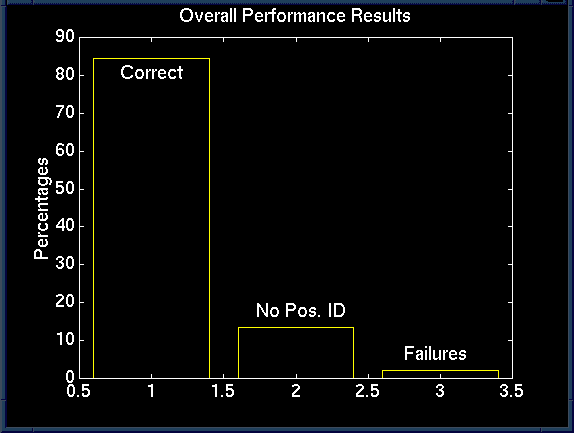
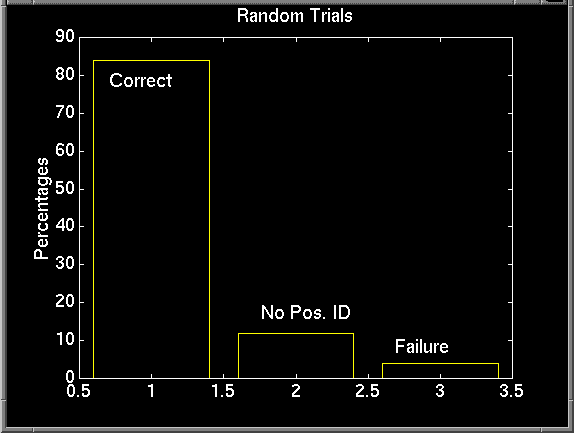
When doing these trials, we found the one could often train their voice over the length of a run. Furthermore, some members would also "mimic" other voices, unintentionally, of course. To remedy this situation, and to also simply gather more independent data, we decided to perform a random trial. We had matlab generate a random sequence of people, and had them run the test in that order. This way, people could not as easily train their voices, or depend on who went before them. The results were relatively the same, with a few more no-ids and less false-ids.
Here is everything you need to run our project: spkrid.tar.gz. Remember, you need an SGI unless you rewrite record!
Questions? Comments? Write us at dspgroup@sal.jones.rice.edu
