Group Members Homepages
Introduction
In modern times, radar is used in a wide variety of applications including defense, air traffic control, meteorology, and even mapping. Radio Detection and Ranging (RADAR) involves the interpretation of a signal to determine characteristics of targets. With the unavoidable presence of various types of interference, signal processing is naturally an important part of any radar system.
The basic idea behind radar is to send out a signal and analyze the return signal. If the signal hits something, it will be reflected back to the antenna. The delay between the time that the signal was sent out and the time that it is received can be used to determine the object's distance. If the object happens to be moving, the reflected signal will have a different frequency from the one that was sent out. The difference between these frequencies is referred to as a Doppler shift. A common example of Doppler shift is that of a train whistle. As the train approaches, an observer hears a higher pitch than the actual pitch of the whistle. Conversely, as the train moves away, an observer hears a lower pitch than the actual pitch of the whistle. The difference in the pitches heard by the observer is due to the Doppler shift. In radar applications, Doppler shift can be used to determine the velocity of an object.
For Range processing, the return signal must first be filtered in order to reduce the effects of clutter and noise that get into the signal due to buildings, mountains, machinery, and other signals. A typical return signal containing a single return burst and white Gaussian noise looks like this :
Return Signal with Noise
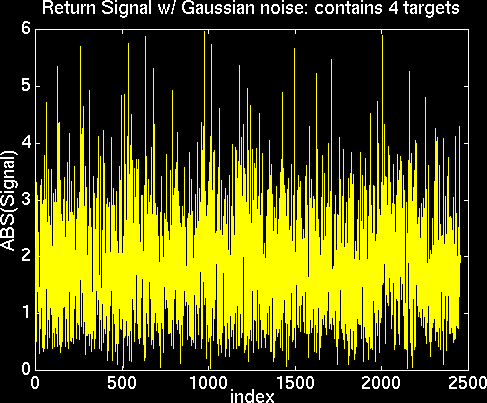
It turns out that the proper filter to use on the signal is a "matched filter" to the original signal. A matched filter is the original signal flipped about the origin on the time axis and then conjugated. Convolving the return signal with the matched filter like this basically amplifies the bursts in the clutter and noise so that the SNR (signal to noise ratio) is large. Here is an example of a return signal after it has been matched filtered (figure 3):
Filtered Signal with 4 Targets
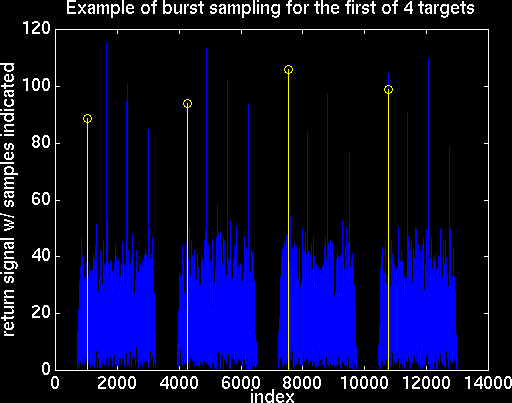
The four peaks in each burst in this example are obvious, and we would want to consider all of these four peaks as targets. To get the ranges, it is necessary to know the time that elapsed between sending the burst and receiving the return burst. It should be clear that it took the signal half of that time to get to the object. With this in mind, the distance to the object can be determined by multiplying the time to get to the object by the speed of the burst (lightspeed=3x10^8 m/s)
Velocity processing can be even more involved. Velocity is determined by means of measuring the change in frequency of the output signal bursts. This shift in frequency is known as the "Doppler shift". Since the change in frequency within a single burst is virtually impossible to measure unless the object is moving with a velocity that is a substantial fraction of the speed of light, the change in frequency is not determined from one burst but rather the change in the frequency from burst to burst over the entire output signal. From this Doppler shift in frequency, the velocity of each target can be found by multiplying by a scaling factor that is dependent upon the carrier frequency of the radar signal and the inter-pulse period of the bursts.
Development
Once some knowledge of radar theory had been gained, we began the task of designing a radar signal processor. First, the type of waveform to be used in the system had to be chosen. An impulse would be optimum for range resolution, but, aside from being impractical, it would also fail to yield any range rate resolution. A complex exponential, on the other hand, would yield optimum range rate resolution while leaving a great deal of ambiguity in the range resolution. A compromise between the two was needed. A good test of potential waveforms is to examine the nature of the ambiguity function. The ambiguity function is essentially an autocorrelation of a waveform with a delayed and/or phase-shifted version of itself. Plotting this function versus delay and phase shift yields a convenient visual gauge of a waveform's potential performance in a radar system. It turned out that a linear FM chirp offered acceptable resolution in range and in range rate. A program, dtFMchirp , was written to generate a discrete LFM chirp for a given time-bandwidth product (TW) and oversampling factor (p). Thus the output was essentially a continuous-time chirp sampled at a rate of p*W. An LFM chirp has a constant magnitude of one, but its phase varies quadratically with respect to its displacement from the time origin.
LFM Chirp
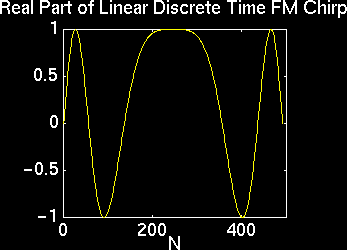
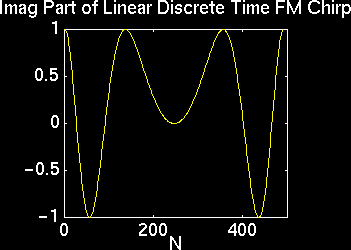
After becoming familiar with the characteristics of the LFM chirp, we worked on range processing. In order to get good range resolution, a high signal-to-noise ratio is needed. Thus, large time-bandwidth chirps were used to increase the energy initially in the signal. This alone is not enough to make target detection possible. Some filtering of the signal must also be done. By examining the equation for the SNR, it is clear that to maximize SNR, the numerator must be maximized. The Cauchy-Schwartz inequality defines the upper bound of the numerator. The equality holds if the filter is the conjugate of the output signal with a reversed time axis. This type of filter is referred to as a matched filter and results in the optimum SNR. Another property of the matched filter is that it compresses the pulse into a narrow peak. As a result, radar systems using matched filtering are often referred to as pulse-compression radar.
Some chirps were generated and white Gaussian noise was added to test our ability to detect and resolve a target in noise. The matched filter results in a large peak in the time domain at the point where the entire pulse has returned. The location of the output peak from the matched filter is used to calculate the range by the following formula:
The length of the chirp must be subtracted from the peak location in order to get the delay from the time the signal was sent out until the time the return signal was received since the peak location indicates the time at which the entire signal has been received, not the time at which it first started to arrive.
 Once the accuracy of this algorithm was confirmed, modifications were made in order to handle
multiple targets. This requires the ability to locate multiple peaks in the filtered signal. For
this, the program pkpicker , taken from CBESP, was used. Given a signal,
a threshold, and a maximum number of peaks, pkpicker returns two vectors, one containing the peak
values and the other containing the corresponding indeces of the peaks. After experimenting with the
threshold, it was determined that a threshold of .6 times the length of the chirp would be adequate.
The length of the chirp is equal to the maximum peak in an autocorrelation of a chirp and so
corresponds to the energy of a target in the absence of interference such as noise and clutter. The
factor of .6 was found through trial and error to be the largest factor that would not result in a
failure to detect a target. Experiments with multiple targets also gave us some notion of the degree
of resolution that could be obtained with multiple targets (ie, how close could targets be before
they could no longer be resolved separately).
Having established an accurate target detection and range finding algorithm, we were ready to attempt range rate processing. Unless the target is moving at an extremely high speed relative to the speed of light, the Doppler shift will be small and very difficult to detect from one pulse. The solution to this problem is to transmit a burst waveform containing repeated pulses. Initially, for simplicity, boxcars were used as the pulse so that some insight into how the parameters of the pulse affect the Doppler shift might be gained. It was determined that the interpulse period affected the width of the main lobe of the DTFT, the height of the main lobe was related to the number of pulses, and the magnitude of the sidelobes depended upon the pulse length. Next, measurement of the Doppler shift from samples of the bursts was attempted. This allows range rate processing with significantly less data and thus faster computation. The sampling was done as follows. Range processing is done with the first burst alone since the additional bursts do not provide any extra range information. For each of the targets detected, each filtered burst is sampled at the location corresponding to the peak location of that target. The Doppler shift for each target is then measured from the peak location of the DTFT of the corresponding sampled waveform. Range rate is then determined by the following formula:
where fd is the Doppler shift in Hz and fc is the center frequency of the radar in Hz. Range rate calculations will obviously be limited since shifts of the peak that are greater than pi will wrap around, resulting in incorrect calculations. Adjusting the center frequency allows the range of velocities that can be correctly calculated to change. As fc is decreased, larger speeds can be calculated, but accuracy of these velocities suffers somewhat. Conversely, as fc increased, accuracy increased, but high velocities could not be detected due to aliasing.
Next, LFM chirps were used as pulses and our ability to detect Doppler shifts of these waveforms was tested. Finally, a complete range and range rate analysis was performed. Once we were satisfied with the performance of this algorithm, it was time to try and analyze a signal that was not arbitrarily generated.
Implementation of Radar Signal Processor
The final goal of our project was the implementation of a radar signal processor in Matlab that would take a noisy return signal containing bursts reflected from several targets, and accurately determine the distance and velocity of those targets. The signal waveform used was a series of linear FM chirps. In addition, the radar processor had to take into account several parameters/restrictions that real world radar systems have to deal with. These are the starting time and length of the receive window, the interpulse period, and the center/carrier frequency of the radar.
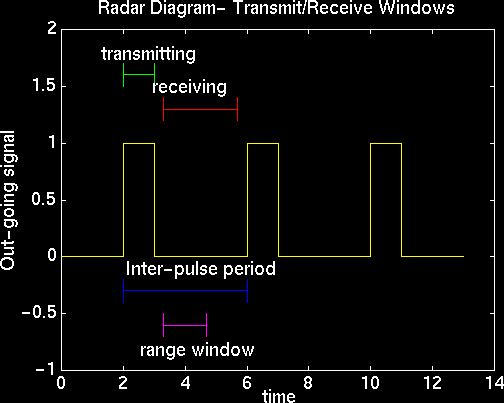
The radar system that we modeled has a single antenna for sending and receiving the radar signal, and can not transmit and receive at the same time. The system alternates modes, first sending a pulse out, and then waiting for returns to come back. Since there is no simple way of determining when a returning pulse was transmitted, the system assumes that any returning pulse was transmitted just before the start of the current receive window. The receive window's starting and ending points determine how far away detectable targets can be. Furthermore, a pulse that was sent out must return completely before the receive window ends to ensure detection. Thus the range of the system is determined by the pulse duration, start of receive window, and end of receive window. Targets outside of this range will not be detected since the radar system is in transmit mode, or will be seen as a closer target since their signal returns will return in a later receive window, in effect resulting in distance aliasing. The range processing ability of the radar system is given by the following expressions:
where c is the speed of light and times are measured relative to when the pulse was transmitted. The following timing diagram shows how the transmission window and receive window are positioned in time.
Timing Diagram
The limits on the range of detectable velocities are determined primarily by two factors, the interburst period and the carrier frequency of the radar. In order to determine the velocity of a target, the Doppler shift of its radar return must be calculated. To reduce the amount of computation needed, a single sample is taken from a target's return signal in receive window. such that they are separated in time by the interburst period. The DTFT of the samples is calculated, and from the location of the peak in the DTFT, the Doppler shift is determined. Since velocity determination involves decimating the original signal, velocity aliasing occurs, limiting the range of velocities that are detectable in both the negative and positive directions. Since the Doppler shift is proportional to the carrier frequency of the radar signal, the carrier frequency also effects how large velocities may be before aliasing occurs. The velocity processing ability of the radar system is given by the following expressions:
The routine radar.m that we used to generate the return radar signals from several targets was provided with the CBESP book. The radar function took several parameters: signal waveform as a vector, sampling rate in microseconds for the waveform, the starting time of each burst in microseconds as a vector (which we kept evenly spaced), the gain factor for each burst as a vector (we kept it as one always), the receive window starting and ending times in microseconds as a vector, the reference time (which we set as 0 always), the carrier frequency of the radar in megahertz, the distances to targets in kilometers as a vector, the signal gains for each target as a vector (which we kept as one always), and the velocities of each target in meters per second as a vector. The function returned a matrix containing all the detected signals during a particular receive window in a particular column. The returns from each target were positioned according to distance and modified according to velocity. Targets outside the receive window were cut off appropriately with no provision for distance aliasing.
On top of the basic radar signal processor we added a small graphical user interface which allows the user to input up to 20 targets on a distance-velocity plane. The radar processor then displays detected targets with X's on the same graph. It also displays numbers next to each target which indicate how high the peak is relative to a isolated target in a noiseless environment. This allows the user to determine which targets are likely to be caused by noise. There was also a provision for keyboard input.
Here is the final code: program.m.
Results
Analyzing the performance of the radar signal processor in a systematic manner is in general a difficult task. There are multiple variables to deal with even without the addition of the random noise. However, there are certain important performance characteristics that must be discussed. These include accuracy of distance and velocity determination, multiple target resolution, velocity aliasing, and effects of noise level.
We also realized that there are a number of tradeoffs involved in choosing radar parameters. The interburst period determines how long a receive window is possible, so it limits the range of the radar system. However, a large interburst period lowers the range of velocity determination. Also a larger carrier frequency lowers the range of measurement since aliasing will occur at lower velocities. However, it improves the resolution of the system since it maps smaller velocities to larger Doppler shifts. Therefore there is a trade off between velocity resolution and velocity range determination. There is also a tradeoff involved in choosing the duration of the signal pulse. A larger pulse, raises the signal to noise ratio after filtering, but it reduces the ability to resolve close targets.
For our simulations we used a series of 5 LFM chirp pulses, each pulse having a length of 7 microseconds and a bandwidth of 7MHz. The interpulse period was 205 microseconds and the radar return receive window started 25 microseconds after pulse transmission and ended 175 microseconds later. The radar system sampling rate and carrier frequency were 14MHz (2x oversampling) and 7GHz respectively. The noise was Gaussian and had a standard deviation of 2 relative to the signal amplitude. With these parameters detectable targets lay in between 3.7 km to 29.0 km away, and moved with a speed under 53 m/s.
Multiple Target Resolution
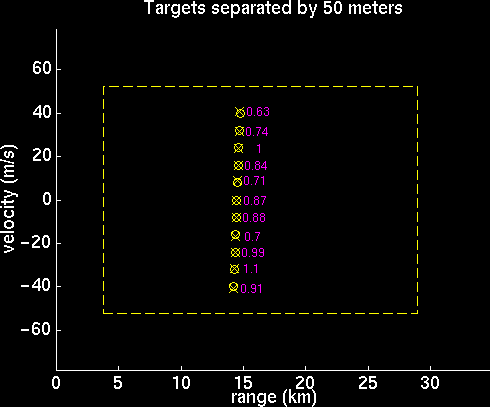
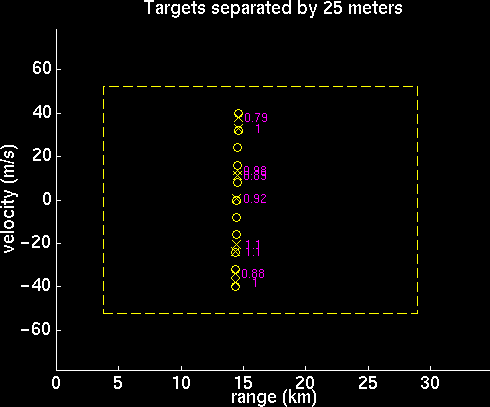
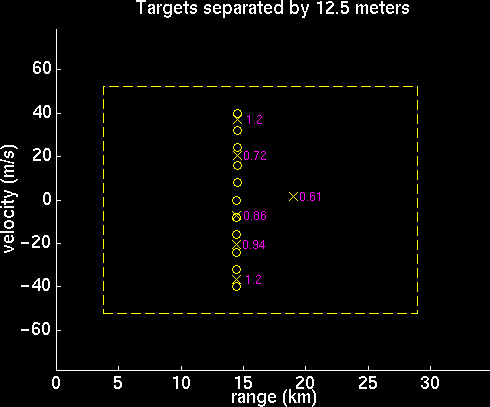
Attempting to analyze the performance of the radar system, it was determined that the most obvious flaw in the range/velocity determination within the bounds was a problem distinguishing between targets that are very close together. After varying the spacing between a set of targets, it was noticed that there is considerable error in the performance of the radar system processor when the targets get within fifty meters of one another. Outside of fifty meters, the error was small enough and infrequent enough that it could be blamed on the random noise. Shown are plots of the program output for targets 50, 25, and 12.5 meters apart. As the spacing decreases, the processor begins to merge many of the targets into one, thereby only picking out part of them, and also giving some ghost targets.
Velocity Aliasing
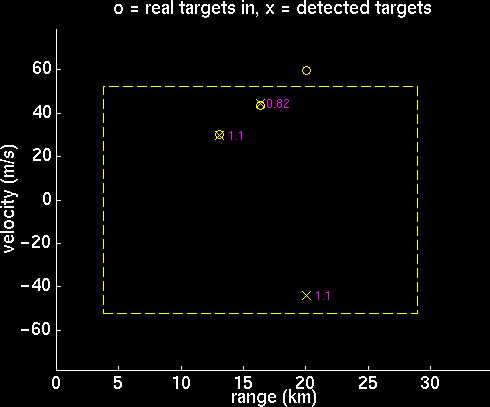
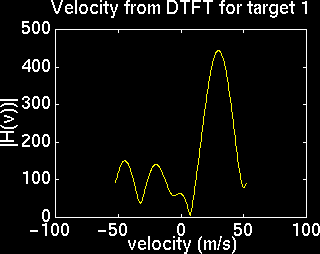
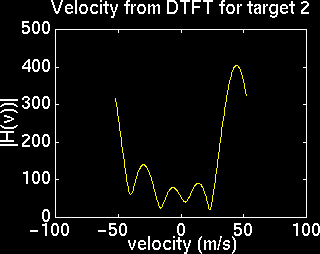
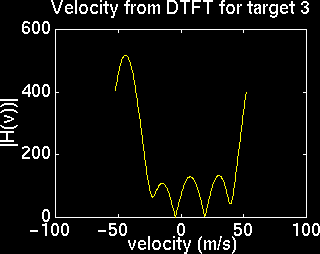
Velocity aliasing occurs when the speed of a target exceeds the maximum detectable velocity. Shown below is a target configuration with velocity aliasing, and the DTFT's used to determine velocity. Note that the peak for one the targets flips to the opposite side.
Noise Interference
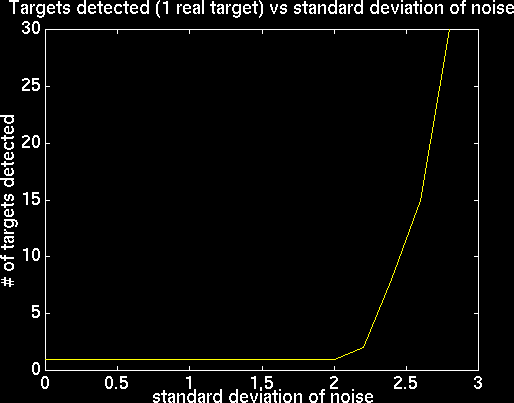
When testing the accuracy of the radar, it is important to know the effects that noise will have on the system. The following graph shows what happens as the standard deviation of the noise increases. One single target was input into the system, the noise level was varied, and the number of targets detected was recorded. From this, it is possible to tell that noise begins to have a large negative effect on the performance of the system when the standard deviation of the noise becomes greater than two.
Accuracy
To test the accuracy of the program, it was run 40 times with the following ranges and velocities:
The difference between these values and the values calculated by the program were assembled into matrices. The average error of the range calculations was .3506 meters. The average error of velocity calculations was .1509 meters/second. The standard deviation of the range error was 2.6279 meters. The standard deviation of the velocity error was .7266 meters/second.
References
J. H. McClellan and R. J. Purdy. Application of digital signal processing to radar. In A. V. Oppenheim, editor,Applications of Digital Signal Processing, chapter 5, pages 239-330. Prentice Hall, Englewood Cliffs, NJ, 1978.
C. Sidney Burrus...[et al.], Computer-Based Exercises for Signal Processing Using MATLAB, chapter 10, pages 317-329. Prentice Hall, Englewood Cliffs, NJ, 1994.
Rihaczek, August W., Principles of High-resolution Radar, New York, McGraw-Hill,1969.
