While various different techniques exist for automated speech recognition, the technique which most clearly highlights the principles of linear prediction and autoregressive system modeling is one based solely upon an AR parameterization of speech. This technique, as with linear predictive speech coding, attempts to segment speech into quasi-stationary frames, and then to characterize these frames by their underlying AR model parameters. Test phrases are compared in the frequency domain to various reference phrases, where the frequency domain representation of all phrases is based solely upon their AR model parameters. Note that this technique makes no attempt to utilize the residual speech component (either voiced or unvoiced) which remains after an AR analysis is performed, but rather bases its recognition entirely upon the AR vocal tract model. In this regard, the speech recognition algorithm is somewhat speaker in dependent -- the vocal tract model should, in theory, capture the "shape" of the vocal tract but not the underlying formant or white noise waveforms (voiced or unvoiced, respectively) which "excite" the vocal tract.
The first step in our speech recognition tests invloved the recording of reference phrases against which various other test phrases could be compared. Two members of our group, Adnan and Charles, each recorded five separate utterances of the the numbers zero through nine. These phrases were originally recorded in 16-bit resolution at 48000 Hz, then digitally filtered in Matlab using a 5th order lowpass Butterworth filter at a cutoff frequency of 3600 Hz. The resulting phrases were then resampled at 8000 Hz. The resulting speech sequences (8000 Hz, 16-bit resolution) offered the benefit of smaller size, in addition to the fact that they more accurately represented the frequency domain characteristics of speech transmitted across a standard POTS telephone connection.
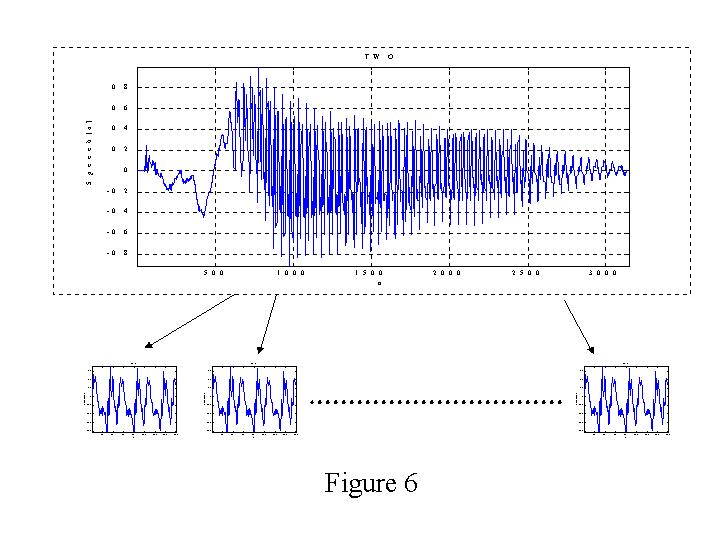
After representing the speech in a more manageable form, we "manually" cropped each speech file to eliminate pre-speech and post-speech anomalies which are not actually part of each spoken phrase. Because our reference phrases numbered 100, we opted to write dedicated Matlab code which allowed us to graphically crop the files while we listened to the results. Our original aim was to crop the files to identical lengths, allowing us to perform each AR analysis using a fixed number of frames having a fixed length. We learned very quickly that this was not possible without significant "padding" of the inherently shorter phrases. Since information contained in the padding would be superfluous, we opted to simply crop each file to the portion containing speech, and to deal with the length mismatches in a different way.
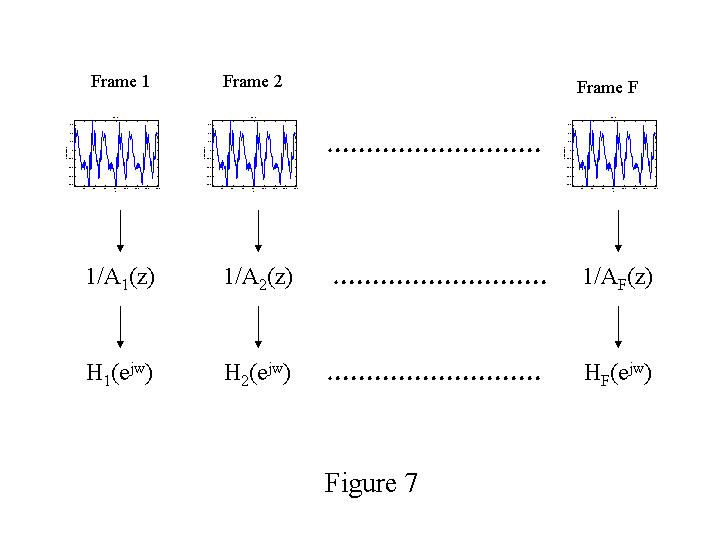
After cropping, our phrases ranged in length from approximately 400 milliseconds to approximately 800 milliseconds. We chose to analyze each phrase using 20 frames of 20 milliseconds each, with the frames spaced evenly throughout each phrase. For each phrase, the first sample of the first frame coincided with the first speech sample, while the last sample of the 20th frame coincided with the last speech sample. All other analysis frames were spaced evenly throughout the phrase. Note that the use of 20 frames of 20 milliseconds ensured that we experienced no frame overlap in our shortest phrase. We arbitrarily chose a model order of 16 for each of the AR analyses, resulting in 16 AR coefficients for each speech frame. These coefficients were then organized into an array of 100 phrases by 20 frames by 16 coefficients.