clear all
load chirp.dat
% signal=signal(1500:2300);
%wig3=zeros;
%for i=1:64:960,
% i1=2*i;
%x=signal(i:i+63);
x=chirp;
N=length(x);
nfreq=2*N;
fs=100;
mlag=N;
x=sinc_interp(x);
x=[x;0];
N=length(x);
lacf=zeros(mlag,N);
for t=1:N,
mtau=min(t,N-t+1);
mtau = min(mtau, mlag);
lacf(1:mtau,t) = x(t:t+mtau-1) .* (x(t:-1:t-mtau+1));
t
end
lacf=[lacf;zeros(nfreq+1-N,N);(flipud(lacf(2:N/2,:)))];
wig=real(fft(lacf))/N;
wig=tfdshift(wig);
%if i==1,
% wig3(i:128,i:128)=wig;
%else
% wig3(i1-1:i1+126,i1-1:i1+126)=wig;
%end
%end
t=1/(2*fs)*(0:N-1);
f=-fs/2:fs/N:fs/2;
f=f(1:N);
figure(1)
ptfd(wig,t,f)
This m-file uses the following m-files.
function out = sinc_interp(x, a)
% sinc_interp -- sinc interpolate a signal
%
% Usage
% y = sinc_interp(x, a)
%
% Inputs
% x signal vector
% a interpolation factor
(optional, default is 2)
%
% Outputs
% y interpolated vector.
If N=length(x) then
% length(y) =
a*N-a+1 and y(1:a:end) = x.
% No extrapolation
is done.
%
% Surprisingly this does not seem to be included with matlab.
% Copyright (c) 1997, 1998 Jeffrey C. O'Neill (jeffo@eecs.umich.edu)
% Copyright (c) 1997 The Regents of the University of Michigan
% All Rights Reserved
error(nargchk(1, 2, nargin));
if (nargin < 2)
a = 2;
end
x = x(:);
N = length(x);
M = a*N-a+1;
% y has length: a*N-a+1
y = zeros(M,1);
y(1:a:M) = x;
% h has length: 2*(a*N-a-1)+1
h = sinc([-(N-1-1/a):1/a:(N-1-1/a)]');
% out has length 3*(a*N-a)-1
out = lconv(y, h);
% what we want has length: a*N-a+1
out = out(a*N-a:end-a*N+a+1);
Along with
function out = tfdshift(in)
% tfdshift -- Shift the spectrum of a TFD by pi radians.
%
% Usage
% out = tfdshift(in)
%
% Inputs
% in time-frequency distribution
%
% Outputs
% out shifted time-frequency distribution
% Copyright (c) 1997 Jeffrey C. O'Neill (jeffo@eecs.umich.edu)
% Copyright (c) 1997 The Regents of the University of Michigan
% All Rights Reserved
error(nargchk(1, 1, nargin));
N = size(in, 1);
M = ceil(N/2);
out = [in(M+1:N,:) ; in(1:M,:)];
Also
function ptfd(tfd, t, f, fs)
% ptfd -- Display an image plot of a TFD with a linear amplitude scale.
%
% Usage
% ptfd(tfd, t, f, fs)
%
% Inputs
% tfd time-frequency distribution
% t vector of sampling times (optional)
% f vector of frequency values
(optional)
% fs font size of axis labels (optional)
% Copyright (c) 1997 Jeffrey C. O'Neill (jeffo@eecs.umich.edu)
% Copyright (c) 1997 The Regents of the University of Michigan
% All Rights Reserved
error(nargchk(1, 4, nargin));
if (nargin < 4)
fs = 10;
end
if (nargin < 3)
f = [-0.5 0.5];
end
if (nargin < 2)
t = [1 size(tfd,2)];
end
if isempty(t)
t = [1 size(tfd,2)];
end
if isempty(f)
f = [-0.5 0.5];
end
imagesc(t, f, abs(tfd)), axis('xy'), xlabel('time','FontSize',fs), ylabel('frequency','FontSize',fs), set(gca,'FontSize',fs);
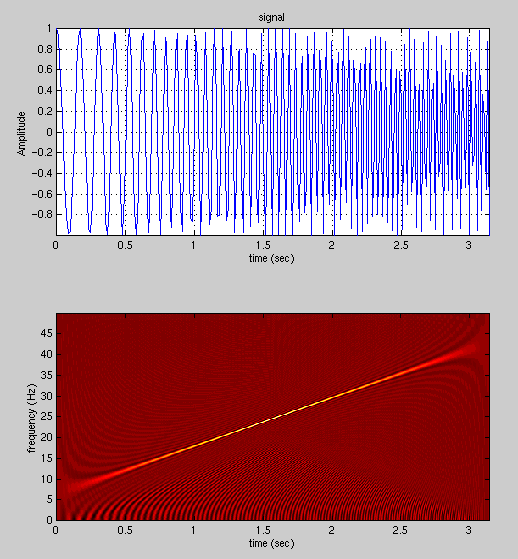
Pseudo Wigner Distribution of chirp signal

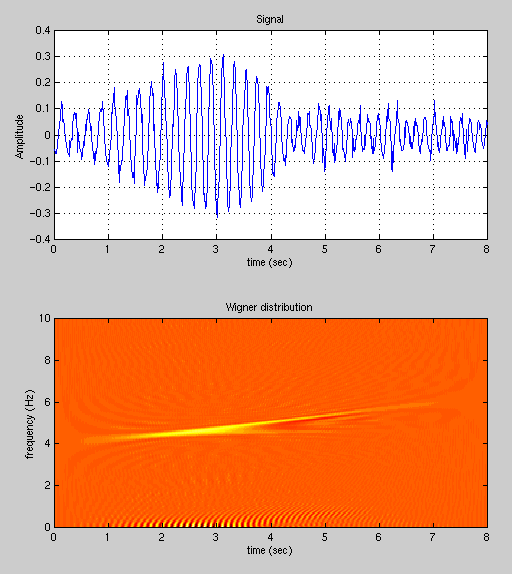
Pseudo Wigner Distribution of displacement signal
