
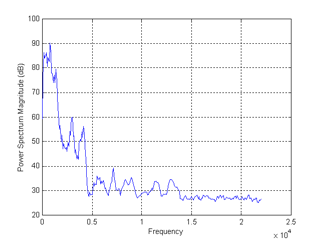
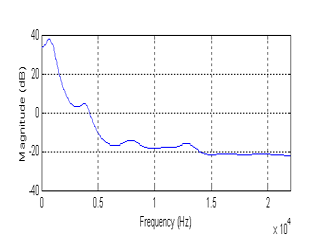
FFT of /a/ as in pot shows power spectral density and formant peaks
The one on left is the actual recorded signal, on right is the approximation via LPC
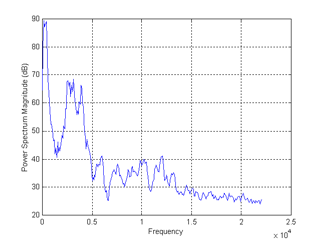
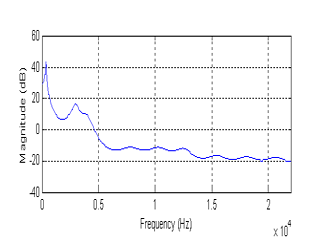
FFT of /a/ as in pot shows power spectral density and formant peaks
The one on left is the actual recorded signal, on right is the approximation via LPC
Spectrogram of /s/ as in send shows frequency content
The one on left is the actual recorded signal, on right is the approximation via LPC
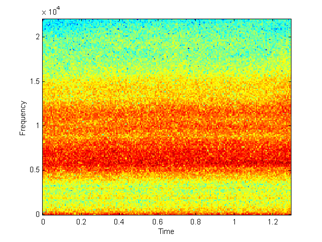
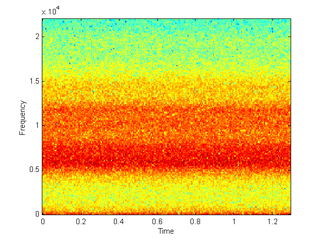
As can be seen from comparing the left and right panes, the signal synthesized using LPC coefficients provide a somewhat close approximation to actual speech.