![[Rice University]](http://www.staff.rice.edu/images/staff/branding/shield.jpg)
Stylometry and Principle Component Analysis
Stylometry (literally, "to measure the style") is the study of linguistic, primarily written, and other expressive styles such as music and painting. One of the main motivations for stylometry arises from the need to analyze texts for authenticity and authorship. Pushing the analogy further, we will see that very similar notions arise when considering relationships in a wide variety of fields from DNA evolution to behavior analysis to drug development to data mining in social networks and retail records.
Focusing on stylometry here as an example, one has to ask the question, what makes two texts by the same author similar? While any well-read person can pick up 2 plays, one by Shakespeare and one by Tennessee Williams, and immediately tell you that they are by different authors. Likewise, when presented by to texts from the same author, human readers often have little difficulty ascertaining that there is a high likelihood of their common origin. But it's not so easy for a computer. On the other hand, can the computer's meticulousness, tirelessness and ability to handle huge amounts of data be able to help us in cases that are not so obvious?
It is a non-trivial task to mathematically describe the elements of style so that a computer can run an algorithm to analyze it. Never forget that computers are just as capable (perhaps more so!) of pumping out the wrong answer as they are the correct answer. In the early days, computer stylometry analysis of texts lead to more disputes than resolutions. See for example, this 1994 dispute over the authorships of C. S. Lewis works, the Bible, and Shakespeare stemming from computer work done in the 1960's!.
Modern stylometry focuses on the writer invariant, which is the notion that any writer has certain invariant characteristics in the words that they choose and the ways in which they arrange words. This can be in the form of idiosyncratic phrases that are used, to particular speech patterns to the lengths of the sentences used. The question is how do you find these invariants, especially considering that one has no idea what one is looking for at the onset? And then you roll in the fact that given the thousands, possibly millions of words in any text corpus and the endless possibilities on how those words could be combined, the size of the space in which one is searching quickly becomes astronomical!
Clusters
Backing up a bit, consider this fact: The exact style characteristics of a particular author are less important than the fact that as "markers", they exist. That is, rather than searching for specific characteristics, search for anything that correlates from one text sample to the next. Now the thing of course is that literature is written by inconsistent, erratic humans, so we cannot expect perfect correlations to exist for anything. What we want to find are clusters of entities that have a high level of correlation to each other. The study of how to find such clusters is called Cluster Analysis and is one of the hottest areas of research and development in both the academic and business worlds. The significance of this area can easily be seen by the length of the list of applications areas at the bottom of the Wikipedia article on Cluster Analysis.
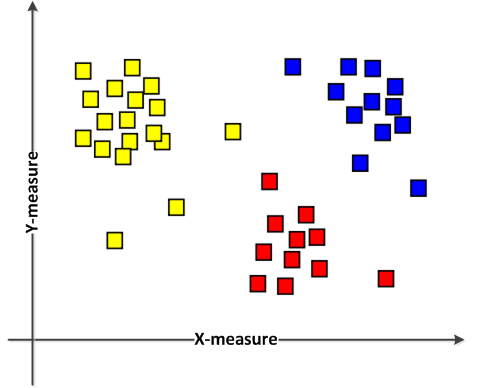
So what is a cluster anyway? Consider the following picture where there is some measure represented by the horizontal position and some other measure represented by the vertical position and where each colored square represents an "experimental observation" (i.e. a data point) corresponding to a particular pair of x-y values. That is, the plot here shows the results of measuring 41 different samples, for instance, 41 books by what seems like 3 authors. Each book is represented as point in the multi-dimensional measurement space. It's easy for our human eyes to pick out the clusters of yellow, red and blue squares, but how can we describe these clusters in a way that a computer can understand? |
 |
One way is to describe the clusters in terms of being distributions around a mean central point with small variances for small clusters and large variances for large clusters. While the study of clusters is a rich and deep field, we will restrict ourselves here to the simpler case where the data only shows a single cluster. Granted, there are a lot of arguments one could make about whether or not this is a reasonable simplifying assumption, but one has to start somewhere. While this assumption simplifies the analysis considerably, we still need to contend with the fact that a text analysis may involve measuring the occurrences of thousands of different aspects of the text.
If we consider the number of occurrences of a particular aspect of the text (we'll get to what sorts of things we could measure later) as a measure of that aspect, then, bending our minds a little, we can think of that aspect as a measurement "axis" in a literary "space", then each different aspect we measure is a different axis in a multi-dimensional literary space. Thus if we take a particular text example and measure all the different aspects in which we are interested, i.e. count their occurrences, then we will have created a single point in that literary space. Ah, but here's the rub: we aren't looking at just 2 or 3 different aspects, which would lead us to an easily conceivable 2 -or 3-dimensional literary space--we are talking about measuring thousands of aspects at once, leading us to, say a 5000-dimensional space!
Principle Component Analysis (PCA)
The study of cluster analysis and the algorithms to implement them are far beyond the scope of this course, so we will restrict ourselves to learning how to use one of the more common clustering techniques, called Principle Component Analysis or "PCA" for short. PCA is geared towards analyzing single clusters in high-dimensional spaces, which is exactly the situation we have put ourselves in.
At the heart of PCA is the notion that while we may be in a thousand-dimensional parameter space, the key features of the cluster are only in a few of those dimensions. Furthermore, the shape of the cluster can be described in terms of some "natural" axes aka "principal components" aka "eigenvectors". This notion of "natural axes" or "eigenvectors" for systems is a fundamental notion in physics, explaining a wide variety of phenomena from resonance effects in musical instruments to quantum states in atoms. the problem is that these natural axes/principal components/eigenvectors are not necessarily aligned with the axes that we are using to describe our multi-dimensional space (the various text aspects we are measuring).
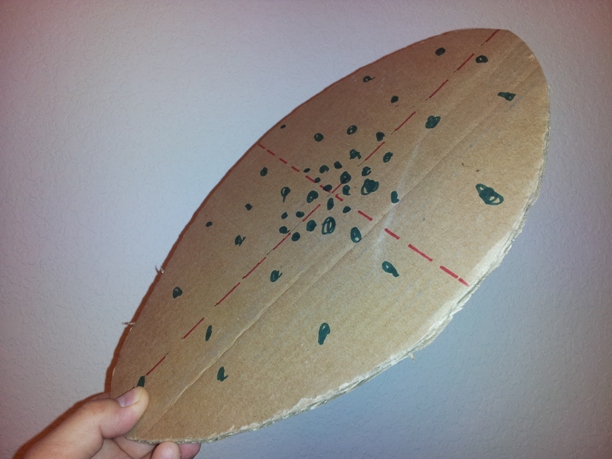
| To visualize the previous paragraph, take a piece of paper and cut an oval out of it. Mark dots all over the oval to represent data points. Now hold the oval at some crazy angle in the air in front of you. The oval represents the shape of the cluster of data points. The oval is a 2-D shape in a 3-D space. Anything "above" and "below" the flat surface of the oval is irrelevant relative to discussing the oval. That is, we could simply think of the oval as sitting in a 2-D plane (albeit a crazily tilted plane from our perspective, but a plane nonetheless) and not worry about the rest of the 3-D space. Likewise, looking at the oval, we see that there are two natural axes with which to describe the oval, its major and minor axes. The major and minor axes decouple the oval into a much simpler notions of a spread in one direction and a spread in an orthogonal (right-angle) direction, enabling us to think about these spreads separately. And yes, these are the same ideas that we invoked when we broke our predator-prey algorithm down into small decoupled functions. |
 |
A PCA analysis of a multi-dimensional data set will attempt to find natural axes through the data points where the "principal" axes or components are the ones which have the greatest variance in values along those axis. That means that the data is essentially spread out along that axis, as an oval is spread out along its major and minor axes. Since, from linear algebra, we know that an N-dimensional space always has N axes, the PCA analysis will return the N natural axes it finds in order of the variance of the data along each axis. We can thus reduce our attention to only the few principal components that have a significant data variation along them, in effect, reducing our problem from thousands of dimensions to just a few. Now that's a huge win in terms of manageability!
In the end, we want to take a new unknown text and compare it against the stylometrics we analyzed from known text sources. Our PCA analysis would reduce our known texts to statistical measures of variation along a few principal components (natural axes/eigenvectors). Remember that any given piece of text is represented as a single point in our thousand-dimension space. If we measure the unknown text source's data point in terms of if its measure along those principal components, we can see whether or not the unknown text's measure is within the expected statistical bounds for those principal components. Mathematically, we are taking the projection of the unknown's data point onto the principal component axes. Once we get those measures, we can make some conjectures as to whether or not the unknown text had the same authorship as the PCA-analyzed texts.
PCA analysis requires that we present each data point as an N-dimensional vector (list) of numbers representing the "measure" of that data point in terms of each "dimension" being measured. We thus need to prepare our raw data, which comes in the form of text files by creating these multi-dimensional measures and assembling our results into lists of numbers, i.e. a list of lists or a matrix.
Measures of Texts
PCA analysis requires that we present each data point as an N-dimensional vector (list) of numbers representing the "measure" of that data point in terms of each "dimension" being measured. In other words, each text sample that we analyze is represented by a single point in the N-dimensional measurement space. But what sorts of measures can we use for texts?
Probably the simplest measure of a text is the word frequencies. Here, each word represents a dimension and the count of that word in text in any given text is the measure along that dimension. One could definitely argue that the measure should in fact be the percentage count of that word relative to the total word count, i.e. the normalized count, to make comparing texts more consistent. The PCA analysis thus looks for correlations of clusters of words, that is, are there groups of words that are consistently used together in a set of texts?
Another possible measure, which is really just an extension of the simple word frequencies, is the frequencies of n-element word tuples. Once again the argument for normalization holds. And generalizing the single word count PCA analysis, we see that the PCA analysis of n-tuple word frequencies would detect correlations of ordered sets (tuples) of words being used together in a data set.
There are of course, many, many possible measures of texts that can be created, but we will focus on the above measures for now. Can you come up other measures?
|
In the 3-D plot to the right, we see the results of a PCA analysis of the (almost) Complete Works of Shakespeare. Each play, sonnet, etc. is represented by a single dot in the plot. This analysis used single-word frequencies as the measures. That does NOT mean however that the resultant "principle component axes" ("PC" axes in the plot), correspond to the frequencies of any specific word. Remember that the principle axes will in general be cockeyed off the main measurement axes, i.e. they will represent a combination of words in specific frequency percentages. (Do you see how this relates to common phrase usage by an author?) Notice how the the data is basically clustered around the origin, the center of the cluster, which is also the origin for the PC axes. In general, this would not be true, but these results have been shifted so that the cluster is centered around the origin because it is a lot easier to analyze that way. The cluster is close to spherically shaped because the dimensions have been scaled (normalized) by the standard deviations, thus reducing ovoids into spheres. An interesting question here is, what are those 4 outliers in the data? |
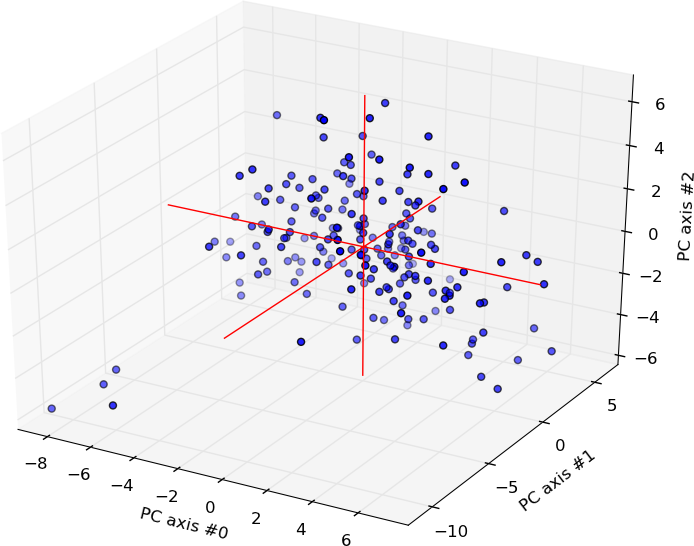 Scatter plot of the Complete Works of Shakespeare (minus Hamlet and All's Well That Ends Well) in terms of the first 3 principle component axes. |