Home | The Problem | How TDS Works | Applications | Other Measurement Techniques | Future Projects
Loudspeaker System Measurements
Determining the on-axis response of a loudspeaker system
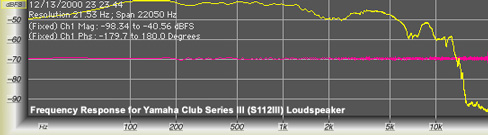
The on-axis response of a loudspeaker is measured with the test microphone pointed directly at the loudspeaker. In other words, the observer is directly in front of the loudspeaker. Note that the loudspeaker and microphone must be at the same height in order to measure the true on-axis response. Below is the frequency response (both magnitude and phase are shown) of a single Yamaha Club Series III loudspeaker. This measurement was intentionally taken in an reverberant environment (the sixth floor lobby of Sid Richardson College at Rice University). The dB scale is marked relative to digital full-scale (0 dBFS is equivalent to digital clipping!), and the way our system was calibrated, the range corresponds to roughly ±3dB, which agrees reasonably with the manufacturer's specifications.
System response shown here with logarithmic frequency scaling
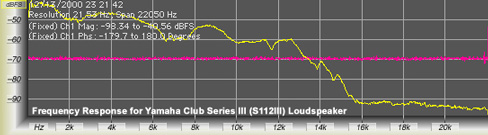
Click here for system response with linear frequency scaling
Determining the off-axis response of a loudspeaker system
The off-axis response is measured when the microphone is rotated on a circle a given number of degrees. We can consider the observer as being at an angle from the loudspeaker. Also, instead of moving the test microphone, we can obtain the same result by rotating the speaker by the angle for which an off-axis response is desired.
Acoustical Characterization of Materials
Just as electrical systems and components can be said to have an electrical impedance, acoustical systems also have an acoustical impedance. This acoustical impedance is made up of a resistive component and a reactive component, just like its electrical counterpart. We can describe the acoustical impedance using a complex frequency response (transfer function) or an impulse response. We may characterize the acoustical impedance of a given material using the TDS technique.
Reflection Characteristics
We can obtain a "reflection response" for a given material by facing the speaker toward the material, and then facing the microphone away from the material and measuring the system response. Note that we must take 'space loss' (the sound absorption response of the air space in the room) in order to get a more accurate reflection response. One can usually compute space loss, although it can also be measured by applying TDS or other measurements techniques.
Transmission Characteristics
Similarly, if we wish to obtain a "transmission response" for a given material, we compare the on-axis response to the on-axis response with the material placed in-between the speaker and the test microphone.
Acoustical Response of a "Room"
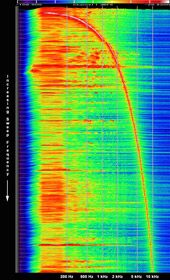
The acoustical response of a room can be determined as discussed earlier. We tested the response of the sixth-floor Sid Richardson lobby from 20 Hz to 10 kHz. In this plot, the horizontal axis represents frequency, vertical axis represents time. Note that the vertical axis goes downward as time increases, and that this so-called "waterfall" plot shows the swept sine wave increasing in frequency as time increases. The colors on the plot represent energy, and we can think of the third axis on the plot 'sticking out' (as the colors go from black and purple to red, the energy increases).
Click on the image for a more in-depth look.
We can see the room "responds" very well at low frequencies, even as the sweep increases in frequency. We can hear often this concentration of power in the low frequencies when we listen play music in the room. One might call it a 'boomy' room. If it is desired, one may damp out this 'boominess' by placing "bass traps" made of special acoustical foam in selected locations around the room. Where and how to place these traps in a given room is just as much of an art as it is a science.
We must always keep in mind that we are selecting one particular input and output location (speaker and observer location). A real room has several recognizably different responses at best, and a rigorous model would use partial differential equations to model our real-world, infinite input, infinite output system. TDS measurements may help guide and reinforce theories developed by acousticians. One popular group that studies acoustics is the Acoustical Society of America.
Home | The Problem | How TDS Works | Applications | Other Measurement Techniques | Future Projects