
Our program compares a test image to a library of sample images. This is accomplished by taking the
average of inner products between each color plane of the test image and the
corresponding color plane of each sample image.
First, the images must be read using Matlab's imread function.
Each image is represented in Matlab as a 3-dimensional x by y by 3 matrix,
where x and y are the height and width, respectively, of the image in
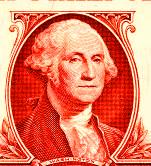
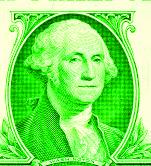
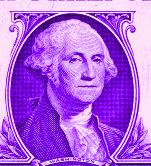
pixels. The 3 x-by-y planes of the matrix are composed respectively of the
red, green, and blue color values of each pixel.
Color values are represented as unsigned 8-bit integers (0 to 255). Matlab's dot function will not work on the unsigned 8-bit class, so it is first necessary to convert the image matrices to double-precision format. This is trivially accomplished in Matlab with the double function.
We also need to make sure that our test image lines up correctly with the sample images. Almost all US currency has a thin border around the main bill image. (The only exception to this is the new $20 and $50. This is OK, since the algorithm picks another spot on these bills with good consistency.) On a reasonable size scan (say, about 250x600 pixels), this border is one pixel wide, and is separated from the rest of the bill by one pixel. We have a corner detection algorithm called findedge.m to detect the upper left and lower right corners of this border. We then crop out those parts of the test images that exist outside of the box defined by these two corners. For a more complete explanation of the corner detection algorithm, look at our page devoted to it.
At this point, we need to normalize each color matrix to try to account for variations in scan intensity, etc. It's important to note that when working with the matrix, we are actually working with one column at a time. First, we normalize a column by taking the inner product of the column with itself. Then we divide each value in the column with the square root of its normalizing value.
Finally, we are ready to compare our test image to the sample library. We take the inner product of each column in the test image with the corresponding column in the sample image. We then average the results for all of the columns. Averaging is good since it is very sensitive to vast differences but insensitive to minor blips and distortions.
The program that does this is found here: imgcomp.m
Once we do this, we need to go back and perform the same operation across all three color matrices. Once again, we average the three results, yielding a figure that represents the average overall correlation between the two samples.
The program that does this is found here: imgcomp3d.m
All of this needs to be pulled together into something larger, in order to be useful. A program called simcomp.m takes two images, and the location of their edges, and computes their inner products using imgcomp3d. The final icing on the cake is the whatami.m Matlab program. This script takes one argument as its input: an image matrix. After that, it does the work for you, by loading the image library (Using inp2.m), finding the edges of the test image, and then scanning across all 14 of the sample images. It then reports which sample image has the maximum correlation. If no image has a correlation greater than 0.85, it rejects the test image as not being a valid unit of currency.