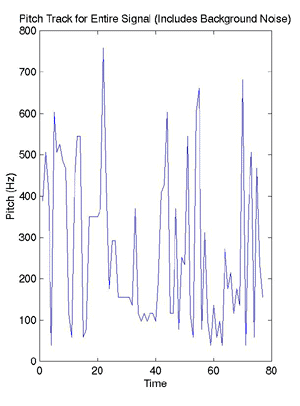
To extract pitch from our signals, we make use of a harmonic-peak-based method. Since harmonic peaks occur at integer multiples of the pitch frequency, we can compare peak frequencies at each time t to locate the fundamental. Our implementation finds the three highest-magnitude peaks for each time. Then we compute the differences between them. Since the peaks should be found at multiples of the fundamental, we know that their differences should represent multiples as well. Thus, the differences should be integer multiples of one another. Using the differences, we can derive our estimate for the fundamental frequency.
Derivation:
- Let f1 = lowest-frequency high-magnitude peak
Let f2 = middle-frequency high-magnitude peak
Let f3 = highest-frequency high-magnitude peak - Then d1 = f2-f1 and d2 = f3-f2.
- Assuming that d2 > d1, let n = d2/d1. Then our estimate for the fundamental frequency is F0 = (d1+d2) / (n+1).
We find the pitch frequency at each time and this gives us our pitch track. A major advantage to this method is that it is very noise-resistive. Even as noise increases, the peak frequencies should still be detectable above the noise. Also, it is easily implementable in MATLAB.
In order to do this, we first find the signal's spectrogram. The spectrogram parameters we have decided to use are a window length of 512 points and a sampling rate of 10000 Hz. We assume that the fundamental frequency (pitch) of any person's voice will be at or below 1200 Hz, so when finding the three largest peaks, we only want to consider sub-1200 Hz frequencies. Thus, we want to cut out the rest of the spectrogram. Before we do this, however, we must use the whole spectrogram to find the signal's energy.
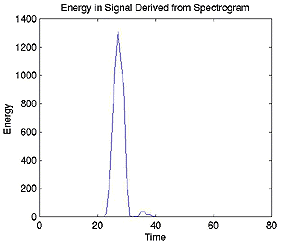
The signal's energy at each time is very important, as it shows the voiced and unvoiced areas of the signal, with voiced areas having the higher energies. Since we are using our pitch track to compare pitch between signals, we want to be certain that we are only comparing the voiced portions, as they are the areas where pitch will be distinct between two different people. A plot of energy versus time can actually be used to window our pitch track, so that we may get only the voiced portions.
To find the energy versus time window, we take the absolute magnitude of the spectrogram and then square it. By Parseval's Theorem, we know that adding up the squares of the frequencies at each time gives us the energy of the signal there. Plotting this versus time gives us our window.
Once this is done, we cut our spectrogram and move on to finding the three largest peaks at each time. A frequency is designated as a "peak" if the frequency directly above and below it both have smaller magnitudes than it does. If a frequency is a peak, then its magnitude is compared to the three magnitude values stored in the "peak matrix" (a matrix of magnitudes and locations for the three highest peaks which start out as zeros at each time). If it is greater than the minimum matrix value, then its magnitude and location replace the magnitude and location of the matrix's smallest peak.

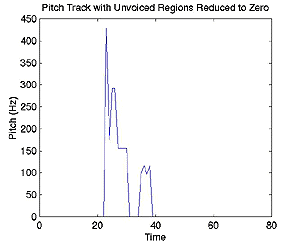
The matrix of peak values and locations at each time is then fed through the fundamental frequency algorithm and we have our uncut pitch track (above)! At this point, we go back to our energy versus time plot and use it to find the energy threshold of the noise and unvoiced areas that we want to cut out of our pitch track. This is done by finding the mean and standard deviation of the very beginning of the signal (assumed to be noise as the person never begins speaking until at least half a second into the recording due to mental processing time) and using these to develop the threshold. Then, the pitch track is windowed with the energy signal, and everything below the threshold is cut out (below). This function, pitch.m, gives a pitch track of the voiced portions of the signal -- it is now ready for comparison with another signal.


Our pitch track comparison program, pitchmaster.m, takes in two signals and finds each of their pitch tracks. It then maps the pitch tracks onto one another using dynamic time warping. After mapping, we take the dot product of the two tracks and divide it by the norms of the tracks as mandated by the Cauchy-Schwarz Inequality to find the percent that they match. This is done twice, mapping the first signal onto the second and then vice versa, and then the highest dot product is taken as the matching correlation.
DESPAIR - "It's always darkest just before it goes pitch black."
Sara MacAlpine
JP Slavinsky
Nipul Bharani
Aamir Virani