|
|
| Properties |
A few interesting properties of the 2D DFT.
|
|
The properties described here can be
best seen with some simple examples. The exampled are laid out by
giving the spatial domain representation followed by the magnitude of
the frequency domain representation and (optionally) the phase of the
frequency information. The phase for the larger squares is mostly an
incomprehensible mess (one of the properties should make it clear why
this is true) and so it is not included. The base image signal we will
use for this illustration is the 2D analog of the square pulse. It is
a square centered in the middle of the image as shown below:
|
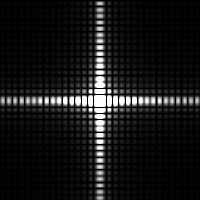
Note that for a two dimensional square pulse, the magnitude of the
frequency is a two dimensional sinc, which is analogous to its one
dimensional counterpart.
|
|
As the math predicts, rotating the pulse by forty-five degrees also
rotates its frequency content by the same amount.
|
|
Analagous to time dilation in one dimensional signals, shrinking in
the spatial domain will cause an expansion of the frequency
content. In this extreme case, a two pixel square pulse expands the
sinc pulse until only the central lobe is significant.
|
|
Shifting the scaled pulse to the upper left-hand corner shifts the
phase along the line y = -x while leaving the magnitude untouched.
|
|


