| Project Members: | Roy Richard Ha | Graham Richard Hull | Ryan Christopher King |
| Introduction: |
| SODAR is, in short, a passive SONAR array. Like SONAR, SODAR is
capable of determining the range and direction of a target based on audio radiation from
it. The final implentation would consist of an arrry of carefully-placed microphones, and a central control unit (a DSP chip or personal computer) to process the inputs from the microphones. The control unit conducts real-time signal processing, and determines the range and azimuth of a point audio source. Once these numbers are computed, the controller renders a display - much like a radar scope - and places a dot on it at the location of the source.
|
Overview: |
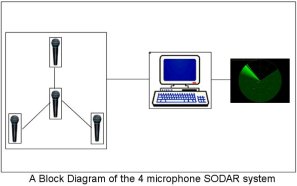
| Figure 1 provides a block diagram of final SODAR system. Four microphones are precisely arranged in a formation commonly called a Y-Array. The number of microphones, array geometry, and distance between microphones have a strong impact on the performance of the SODAR system. Specifically, angular resolution is greatly improved with four microphones in a Y-Array, and the distance between microphones affects range and frequency performance. This will be explained more thoroughly in the Details section. |
| With the delays between the central and peripheral microphones, we can now triangulate to pinpoint the target's location. This result can be shown on a polar plot, which provides a convenient graphical display. |