ELEC 301 Final Project: Text Independent Speaker Recognition
Training System Architecture
The training system architecture we created consists of two main parts. The first part consists of processing each persons input voice sample to condense and summarise the characteristics of their vocal tracts. The second part involves pulling each person's data together into a single, easily manipulated, three dimensional matrix.
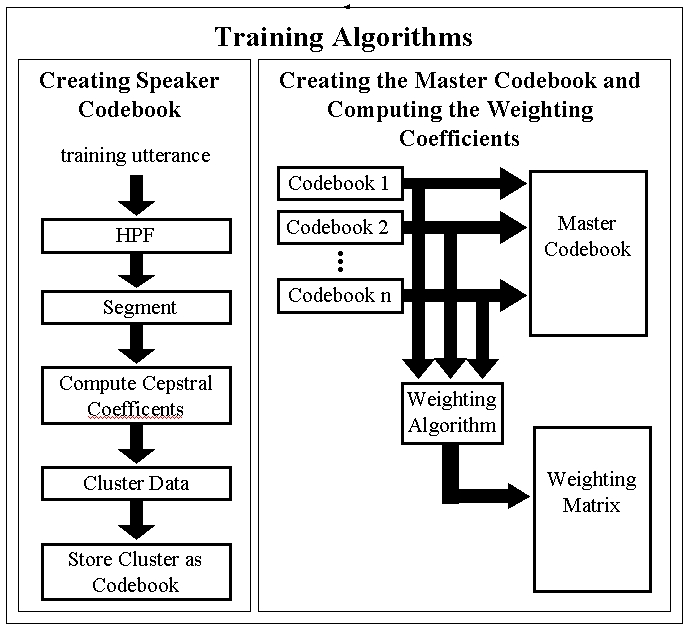
The first thing we did was record the speaker reading for approximately a minute. We designed phonetically rich sentences in an attempt to fully capture each persons distinct vocal features. These sentences use every consant, vowel, and diphthong in the English language at least once. We recorded the sentences at 16 kHz sampling rate, 16 bit quantization.
After recording the sentences, we began to manipulate them in order to condense the data. We first high-pass filtered the signal because the more important information for speech processing lies in the higher frequencies according to Kinnunen and Franti [1]. We then split the signal into overlapping frames, each about about 20ms long. Speech is made up of distinct sounds strung together into words and sentences. By breaking the signal into frames, we approximate these distinct sounds in our analysis. For each frame we calculate the first 12 mel-cepstral coefficients. We also calculated the delta-mel-cepstral coefficients and the delta-delta-mel-cepstral coefficients. These are the derivatives of the mel-cepstral coefficients and characterise the way in which a given person's vocal tract changes in time. For each speaker there are about 6,000 of each of these 12 dimensional vectors.
Roughly 18,000 vectors for each speaker is a very large amount of data to store. The next step is therefore to condense this data. This is called vector quantization (VQ) and is accomplished by a clustering algorithm. The clustering algorithm takes a number of random vectors and condenses the vectors that are nearest to it, iterating until the least mean error between the vectors is reached. We clustered our data into 64 vectors, and each of these vectors is called a codeword. This set of vectors, or codewords is created for each speaker. The codewords for a given speaker are then stored together in a codebook for that speaker. Each speaker's codebook is then stored together in a master codebook which is compared to the test sample during the testing phase to to determine the speaker.
WeightingSuppose there is a region of space where codeword vectors from several different speakers lie. If a test vector also falls in this region, the codewords do not help determine the identity of the speaker because the errors between the test vector and the various codewords will be roughly equal. Kinnunen and Franti [1] present an algorithm for discriminating between code vectors during the testing phase to help solve this problem. Their idea is to give a higher precedence to code vectors which give a more definite idea of a speaker's identity by weighting them. We used the algorithm they presented and computed weighting coefficients for our codebook data during the training phase.
| Model of the Codewords
of 3 speakers 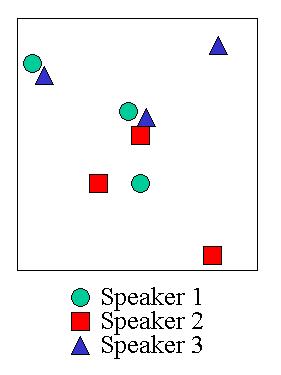
|
Real Plot of 5th and 6th Dimensions
of the Codewords for 3 Speakers 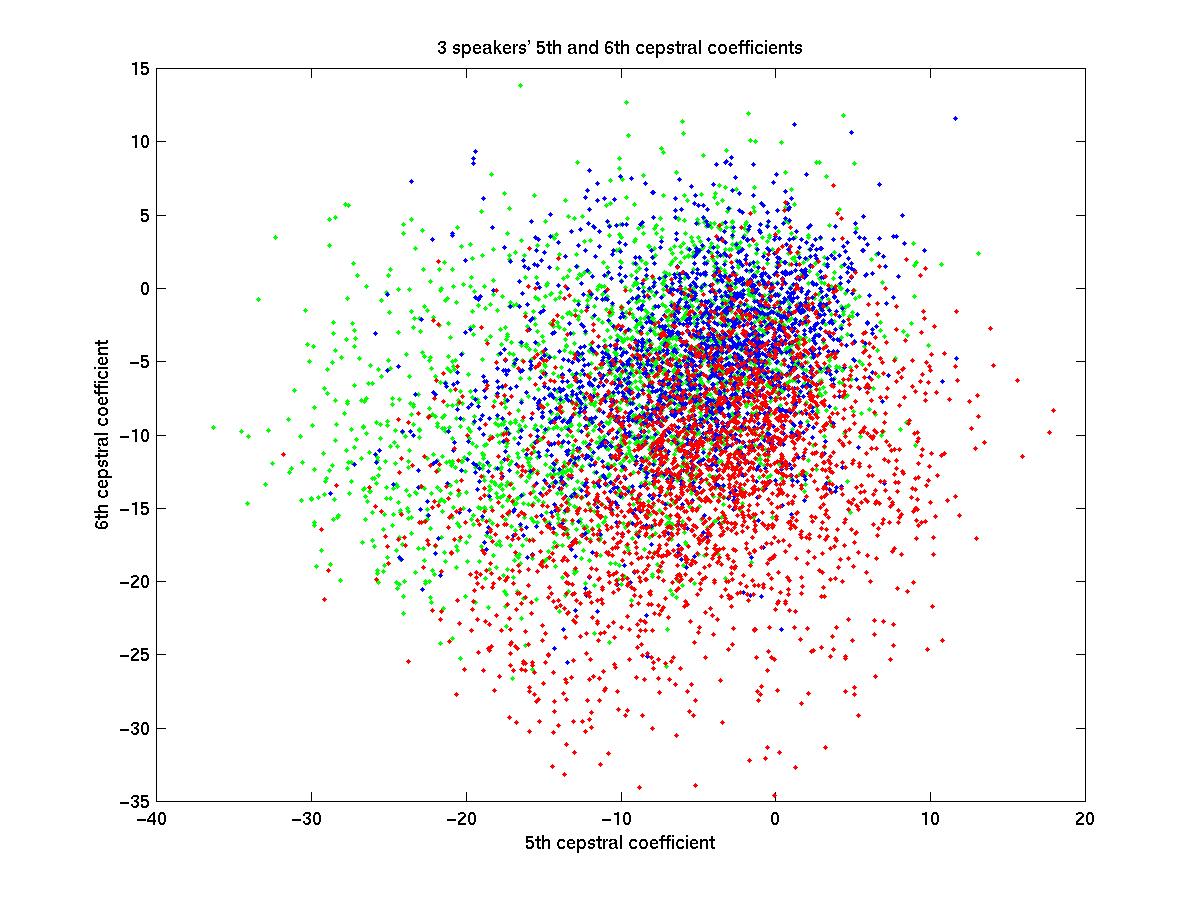
|
The images above depict code vectors in a model, and in reality. In the model, each shape represents a different speaker. You can see that there is a cluster of codewords in the middle. If a test vector were to fall in this region, we would not be able to determine the speaker. In the top left corner is a blue triangle with a green circle. If a test vector were to fall in this region, we would be able to deduce that the speaker was either the circle or the triangle, eliminating the red square. If the test vector happened to fall in the region of the lonely blue triangle in the upper right corner, we could deduce that the speaker was the triangle. The code vector in the corner is therefore the most powerful with respect to determining the speaker, and is therefore given a higher weight than the vectors on the left, which are in turn weighted more heavily than the vectors in the middle. The weighting coefficients serve to discriminate in favour of code vectors which provide the most useful information. In the image on the right, you can see the real codewords graphed. Recall that these are 12 dimensional vectors of the cepstral coefficients. The image shows the vectors projected into the 5th and 6th dimensions only. You can see that the distribution of the real vectors is slightly less ideal than the model. Weighting the vectors does make a difference though, even if it is small.
The algorithm iterates through every codeword in every codebook in the master codebook. It computes the distance between the current codeword, and every other codeword in the other speakers' codebooks. The distance measure we used was Eculidian distance. These distances are inverted, and then added together and the result is stored as the weighting coefficient for the current codeword. The algorithm then moves on to the next codeword and repeats.
Click here to view the matlab file we wrote to calculate the weights.
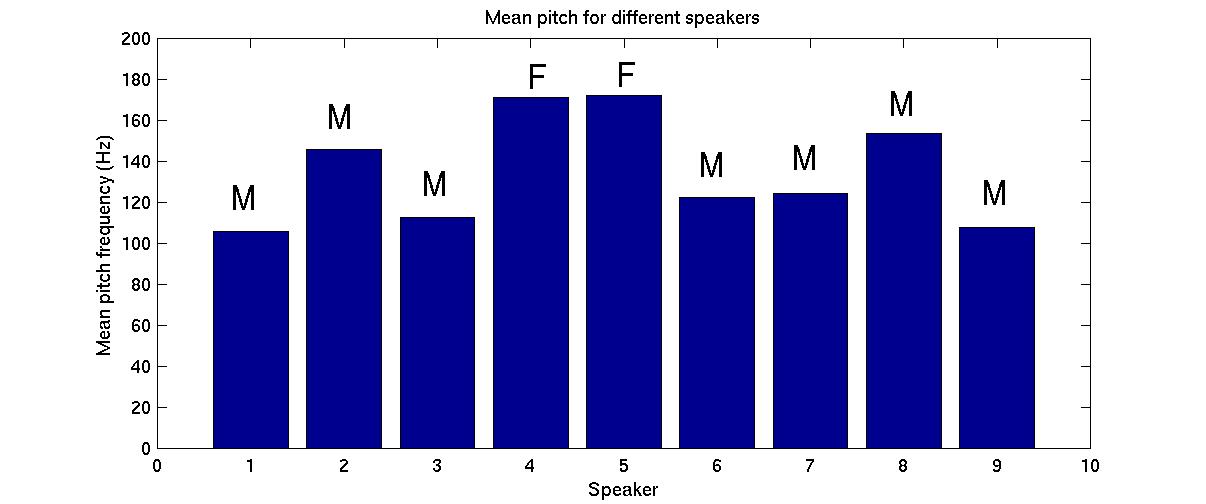
Pitch CalculationsWe also looked the at pitch information for our speakers. We extracted the mean pitch for each speaker using the mel-cepstral coefficients. The pitch of the human voice is at a much lower frequency than the formants which characterise the vocal tract, so we framed the signal into longer chunks, 50ms, and calculated the cepstral coefficients for each frame. The cepstrum turns the pitch into a pulse train with a period that equals the pitch period of the speaker. The range of human speech is from about 80Hz to 300Hz, so we looked for this pitch period to be between 3.25ms and 12.5ms. Since un-voiced phonemes such as the letter 's' do not have pitch, we did not calculate pitch for vectors without a significant peak in this range. We then averaged the vectors which gave a valid estimate and stored it as the mean pitch for that speaker. Below is a graph of the mean pitch for males and females who recorded test sentences.
Click here to view the matlab file we wrote to calculate the pitch.
System
Architecture
System
Architecture