 Stop
the Violins!Stop
the Violins!
Stop
the Violins!Stop
the Violins!
| Background | Process | Group | Images | Code |
Process
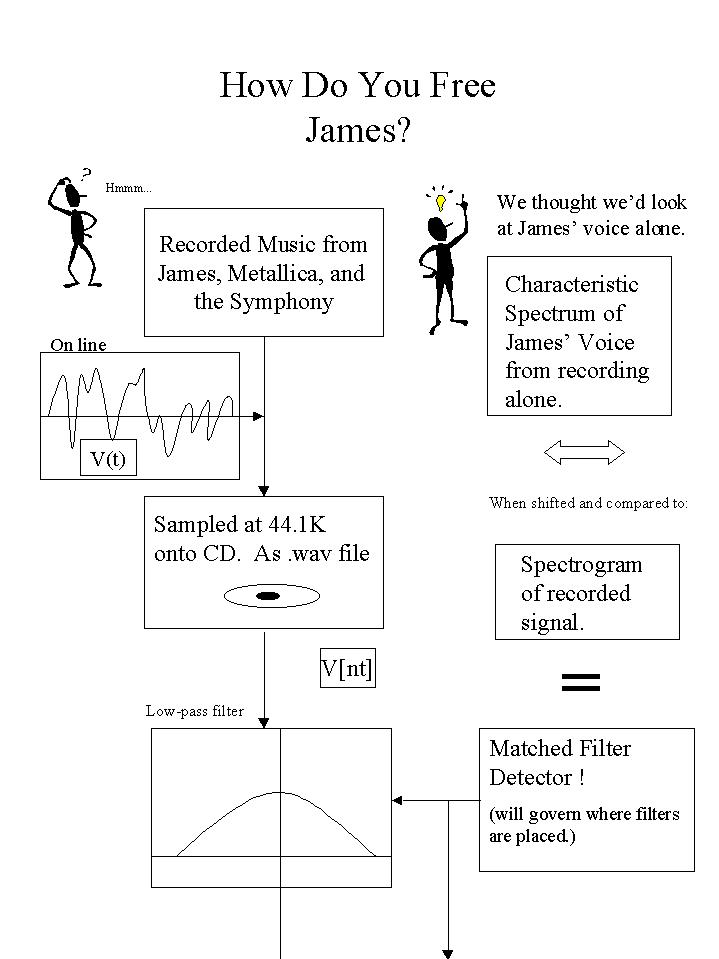
The basic idea of our filter design is to find and adapt to the voice of the singer and then attempt to remove all frequencies that are not part of the singer's voice.
We began by scouring the Metallica repertoire for a moment during which the singer, James Hetfield, was singing completely alone, and, in a word, singing. We found that the frequency signature of the standard rock and roll scream was very difficult to distinguish from noise (a point that many of the elder generation will surely appreciate), so we needed an example of real, well-defined singing. We managed to isolate a 2.4 second sample containing the words "Let my heart", and we used that sample to characterize the singer's voice. There was evident diversity in the frequency signatures between the different words and pitches, so this restricted the precision to which we could focus in on a particular spectrum. However, there were some obvious similarities that we were able to use in filtering.
From the 2.4 second sample, we took a single spectrum that appeared to be representative of the singer's voice in general. It came from the end of the word "Let", pictured at 0.5 seconds in the spectrogram. This single sample was the pattern with which we implemented a matched filter in the frequency domain to try to distinguish and locate the singer's voice in the music.
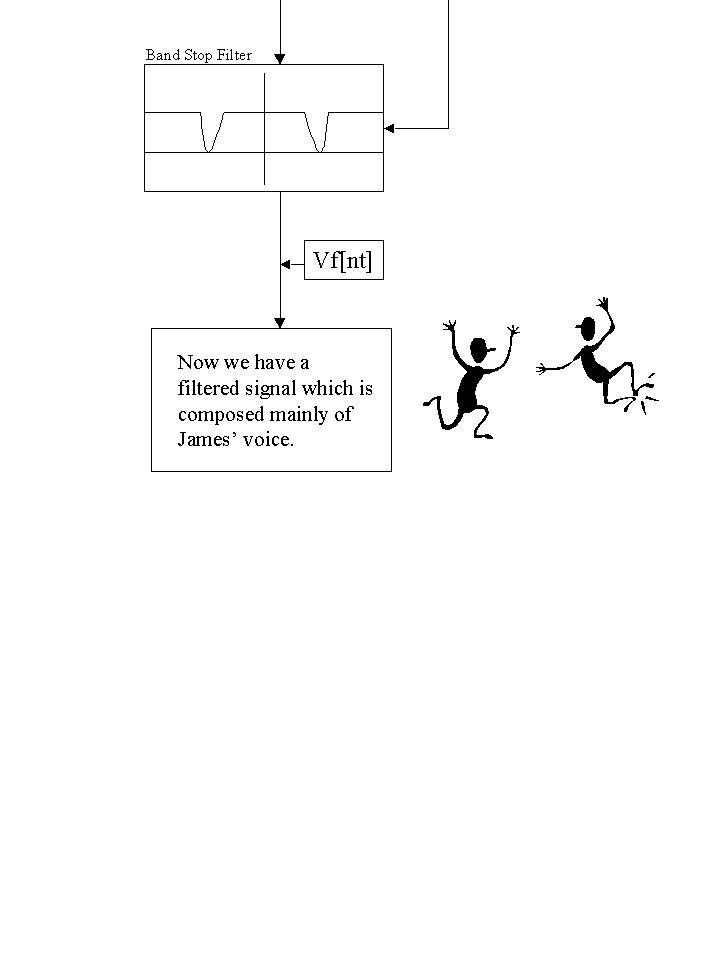
The matched filter, implemented in findvoice.m and stopbands.m, relies on the assumption that all samples being processed would contain constant singing. Therefore, the filter does not use any sort of a correlation cutoff to determine the presence of singing. Instead, the filter finds the largest relative correlation between the pattern and the spectrum of a signal sample. The program findvoice.m produces an integer that indicates the amount that the pattern needed to be shifted in order to correlate maximally with the input signal. This data was used to place bandstop and lowpass filters in stopbands.m. The bandstops are located at approximately 5 kHz and 15 kHz, and the lowpass cutoff is at around 20 kHz relative to the pattern. Shifting the filters accommodated the different vowel sounds and pitches of the song.
In a qualitative analysis of unfiltered and filtered sounds, we discovered that lowering the cutoff frequency of the lowpass filter significantly degrades the quality of the singer's voice, and placing any other bandstop filters was likewise destructive to the sound of the singer. Basically we cut out as much as we could without sacrificing significant quality.
In terms of the actual processing of data, we took five second segments of .wav files recorded from CD's. The segments were sampled at 44100 Hz, so when we input them into Matlab using the 'wavread' command they were vectors 220500 entries long. This was about all that we could squeeze into our owlnet quotas.
Each signal segment was broken into approximately 215 pieces, each 1024 entries long. Our assumption was that the signal would remain constant over these small time intervals, though, in retrospect, the sampling interval could have been extended without loss of quality. The pieces were put into the frequency domain using 1024 length fft's (how appropriate) and filtered. The filtered samples were then put back together to form the output vector.
Overall, we managed to increase the relative volume of
the singer's voice while suppressing the high frequency instruments. It
was difficult to filter out lower frequency instruments because they occupy
much of the same frequency as the voice. The combination of the loss of
some high frequencies and clipping during reconversion to a .wav file created
considerable distortion in both the voice and the instruments. However,
we did succeed in effectively "stopping the violins".
Background Process Group Images Code