 |
 |
Syllabus
Lab Resources
- Agarose Gel Electrophoresis
- Bacterial Streak Plate
- Bacterial Transformation
- DNA Ligation
- PCR
- Pipettors
- Plasmid DNA Isolation and Restriction Enzyme Digests
- Preparation of Agar Plates
Pre-lab Preparation
- Pre-lab preparation
- Laboratory Citizenship & Performance
- BIOC 111/112 Honor Code
- Molecular Biology Tips
- Writing Up Methodology
Additional Resources
BIOC 111 Day 2
Agarose Gel Analysis of Plasmid DNA
OWL-Space Resources
|
Class Videos |
|
Day 2 |
|
11: Agarose Gel: Loading Samples |
| |
|
12: Agarose Gel: Electrophoresis |
|
QuickLoad_1kb_DNAladder.pdf |
|
13: Agarose Gel: Analysis |
|
Introduction
DNA work will continue with the following activities. Today you will use analyze the plasmid DNA that you prepared last time using agarose gel electrophoresis
Background
AGAROSE GEL ELECTROPHORESIS OF DNA
DNA is driven through the agarose matrix by electric current. Smaller or more compact molecules pass through the matrix easier and migrate farther than large molecules. All DNA has the same charge per unit length and linear pieces migrate according to size. The range of sizes separated in a gel is controlled by the % of agarose in the gel.
| Resolution Versus Matrix Concentration | |
|---|---|
Agarose |
Useful for Range of Linear dsDNA Molecules (kb) |
0.3 |
5 - 60 |
0.6 |
1 - 20 |
0.7 |
0.8 - 10 |
0.9 |
0.5 - 0.7 |
1.2 |
0.4 - 6 |
1.5 |
0.2 - 3 |
2.0 |
0.1 - 2 |
| *Information from Molecular Biology LabFax, ed. T. A. Brown, Academic Press, 1991 | |
| The mobility is proportional to the voltage applied at low voltage but increasing voltage decreases the resolution of larger fragments of DNA. A general guideline for agarose gels in 1xTBE is 5V/cm maximum for resolving fragment lengths greater than 2 kb. The distance between the electrodes serves as the length in the calculation. Higher voltages increase the temperature of the gel causing increased band width and distortion of the lanes. The agarose can also melt, especially the low melting point agarose sometimes used when DNA is to be recovered from the gel. The mobility is also influenced by the choice of buffer systems. Besides the Tris Borate EDTA, pH 8.3 (TBE) buffer used in our experiments, a Tris Acetate EDTA buffer (TAE) is preferred by some. The TAE buffer shifts the range of resolution toward higher fragment lengths. | 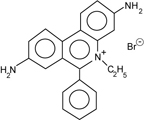 Ethidium |
The nucleic acids are visualized with ethidium bromide (EtBr). This fluorescent dye, which contains a tricyclic planar group, intercalates between stacked base pairs of nucleotides and, in this environment, fluoresces when excited with ultraviolet light; the fixed position of the planar group and its close proximity to the bases causes dye bound to DNA to display increased fluorescent yield compared to free dye.
- UV radiation at 254 nm is absorbed by DNA and transmitted to the dye, whereas radiation at 302 and 366 nm is absorbed by the bound dye
- energy is re-emitted at 590 nm in the red-orange region of the visible spectrum
NOTE: most commercial UV light sources emit at 302 nm, which yields slightly less fluorescence than at 254 nm but produces LESS nicking of DNA.
We will include EtBr in the gel only. In this case the dye extends the length of linear and relaxed circular DNA by about 15% (the molecules are more rigid which decreases their mobility). Supercoiled DNA is positively supercoiled by ethidium bromide. Thus, the mobility of supercoiled DNA with respect to linear and relaxed circular DNA varies with the concentration of ethidium bromide present during the run.If a DNA sample is too dilute to measure at 260 nm or is contaminated with other compounds that absorb in the UV range, the amount of DNA present can be estimated from the intensity of ethidium bromide fluorescence. Since the amount of DNA in a solution is proportional to the fluorescence emitted by ethidium bromide, the DNA quantity in an "unknown" solution can be estimated by comparing its level of fluorescence with the intensity of known amounts of DNA.
| The molecular weight DNA markers used in our study are Quick-Load 1 kb DNA Ladder (New England Biolabs, Catalog #N0468S). The ladder (see figure) produces eleven DNA fragments ranging in size from 500 to 10,000 base pairs (see picture). This ladder can be used to quantitate the amount of DNA in a sample; the mass of DNA in each band in the ladder has been calibrated. | 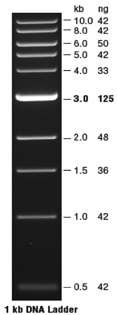 |
| The size of linear fragments of DNA is determined by comparison to standards: the log10 (# base pairs) is plotted versus distance migrated or Rf value {Helling R.B., Goodman H.M., and Boyer H.W. 1974. Analysis of endonuclease R-EcoRI fragments of DNA from lambdoid bacteriophages and other viruses by agarose-gel electrophoresis. J. Virol.14: 1235-1244}. | |
| The loading buffer (LB) combined with the DNA samples contains two tracking dyes, bromophenol blue and xylene cyanol, for visually monitoring electrophoresis and glycerol to make the sample dense enough sink to the bottom of the well; the stock solution is designed to be diluted about six fold in the sample. Bromophenol blue runs about the same size as a linear double-stranded DNA molecule of 300 base pairs in length in 1X TBE on a gel of 1% agarose. In low percentage gels of 0.4% agarose, the dye can emulate a 1000bp fragment. Remember not to run this dye off the bottom of the gel when you are trying to analyze small fragments. Xylene cyanol runs about the same as a linear double-stranded DNA molecule of 4kb in a 1% agarose gel. |
Experimental overview
The procedures for today involve gel analysis. On some procedures you will work as an individual; on others you will work as a team. Make sure that you use the appropriate pipettor and set the volume correctly—if you’re unsure, then ask. Record all procedures and data in your lab notebook, indicating “who” performed a procedure step when you work as pairs; turn in copies of notebook pages at the end of the laboratory session.
- Agarose gel electrophoresis of DNA (two teams will share a gel)
SPECIAL NOTE: Record enough procedure details in your notebook during lab today so that you can repeat these procedures using your notebook as the ONLY resource. Write the methods in your own words (i.e., do not just “copy” the steps from the web page or handouts).
Agarose gel electrophoresis of DNA [0.8% agarose in 1X Tris-borate-EDTA (TBE)]
PROTOCOL
- Thaw uncut control, single digest, and one of the
double digests at room temperature and
pulse spin samples
- Add 5 µl 6X loading buffer III (6X
LB) to each sample
NOTE: 6X LB contains
0.25% bromophenol blue
0.25% xylene cyanol FF
30% glycerol (in water)
[from Sambrook, J., Fritsch, E.F., and Maniatis, T. (1989) Molecular Cloning: A Laboratory Manual, Second Edition (Cold Spring Harbor Labortory Press)] - The instructor or TA will load 10 µl of Quick-Load 1 kb DNA ladder (New England Biolabs)
- Carefully load ALL of each sample (30 µl) into different wells in the gel and record the order of the samples in your notebook (record the location of each sample, not just the ones that you loaded). Do not press the tip into the bottom of the well while loading--allow the sample to sink there.
- Position the lid and connect the electrodes so that the anode is at the bottom of the gel (“run to red”). PLEASE NOTE: Banana plug fittings are not to be turned or twisted. Only push on and pull off by grasping the plug (or the entire lid for the boxes) without turning.
- Turn on the power supply (switch is located on the right side).
- Select “voltage” and set the voltage to 130 V using the raise/lower arrow keys; after the voltage is set, press the RIGHT SELECT button until DISPLAY is lit to monitor the actual voltage (v) and current (ma) during the run.
- Press RUN. The 500 bp standard will run just behind the dark blue dye front, and smaller fragments that run ahead of the dye may not be visible in this type of analysis.
CAUTION: Lethal voltages are present while the power supply is "ON." Do not touch the gel or buffer until the electrodes are disconnected.
- STOP the run after 45-50 min. Once the voltage is “zero” turn off the power supply, disconnect the electrodes, and carefully remove the lid.
- Ethidium bromide (EtBr) is a probable carcinogen and should be handled with care. Wear gloves when handling contaminated equipment or solutions containing ethidium bromide. Confine the compound to the restricted area. After running the gels, use paper towels and plastic wrap to protect equipment and surfaces from being contaminated.
- Dispose of the gels in the Biohazard Waste
Box. Do NOT put paper towels, plastic wrap,
or gloves in this waste box--ONLY the gels.
Remember: Wear gloves and DO NOT spread EtBr outside the designated area!!
- Wear gloves and place casting tray with gel onto paper towels and carefully carry to the photography area. DO NOT spread EtBr outside the designated area!! From this point forward, assume that your gloves are contaminated with EtBr. Do not touch anything with those gloves that is not supposed to be contaminated.
- Place gel onto a sheet of plastic wrap on the transilluminator. CAUTION: The gel is still laden with EtBr and should be handled only with gloved hands. Scrupulously avoid all skin contact with the gel.
- The instructor or TA will take pictures for you using the UVP BioDoc-It™ System (components are listed below).
- Dispose of the gels in the Biohazard Waste Box. Do NOT put paper towels, plastic wrap, or gloves in this waste box--ONLY the gels.
 HEALTH HAZARD
ATTENTION: Avoid doing anything that would unintentionally contaminate the transilluminator or camera with EtBr. For instance, do NOT lay gels directly on the transilluminator, but always on plastic wrap. Do NOT contaminate the equipment (door knob, camera, printer, etc.)--REMOVE your gloves FIRST.
Gel Documentation with a UVP BioDoc-It™ System (Ultra-Violet Products Ltd, Upland, CA)
System Components
- CCD Video Camera
- Zoom Lens
- UV Blocking Filter--the orange-colored filter absorbs UV and IR radiation from the transilluminator and enhances the orange/pink bands of ethidium bromide stained gels
- Transilluminator (302 nm)
- Darkroom Cabinet
- LCD Monitor
- Thermal Printer
Homework Assignments
Prepare item 1 of the homework assignments in your laboratory notebook and turn in the duplicates at the beginning of the next laboratory session. Complete item 2 on Owlspace.
1. Analyze an agarose gel (attach either an enlarged
copy or the original picture of the gel to the homework pages)
Identify the restriction enzymes you used for the single and
double digests. Use the plasmid map and the picture of
your gel from today to obtain the following information:
- Look at the location of the digested DNA fragments on the picture of the gel. What are the apparent sizes of these bands for the single digest and for the double digest in comparison to the standards on the gel?
- Watch the class video in OWL-Space about "Agarose Gel Analysis." Use the picture of your gel from day 2 to hand draw a DNA standard curve in your notebook. A computer-generated plot is not appropriate for this application. Plot log10 (# base pairs) versus distance migrated from the well (i.e., top of the gel) and use the graph to estimate the sizes of the restriction fragments for each digest reaction. Construct a table for the standards containing #bp, log10(#bp), and distance migrated (cm or mm); construct a second table that contains the restriction enzyme(s) used in each digest reaction and the distance migrated for each resulting DNA fragment. Show all measurements and calculations. Do these sizes agree with the apparent sizes that you observed on the gel?
- Compare the experimental results (from analysis of agarose gel) with the expected sizes (as predicted from plasmid map). Do they agree? If not, suggest possible reasons for the discrepancy.
2. Materials and Methods section from a published research article (Literature Example): Look up a published research article that uses molecular biology techniques similar to those you have used in this lab course.
- Bring a copy of the FIRST page of that article and the Materials and Methods section to class with you
- In the methods section, circle or highlight methods that are similar to the ones that you used in this lab course
3. Complete and submit the graphing quiz
Complete and submit the graphing quiz before your lab day 3. It is a timed quiz (1 hour), so be prepared. You are welcome to review the tutorial and the pre-quiz as many times as you like before taking the timed quiz. Do not "begin" if you are not ready to complete the quiz--your work will be submitted automatically after 1 hour (you can't "start" it and come back to it later). Once you start the quiz you are to answer the questions from memory without consulting either resource.
We would like to thank New England Biolabs for their generous support of this laboratory course
![]()
Visitors: to ensure that your message is not mistaken for SPAM, please include the acronym "Bios211" in the subject line of e-mail communications
Created by David R. Caprette (caprette@rice.edu), Rice University14 Jul 08
Author: Beth Beason Abmayr, Ph.D., Rice University
Updated 3 January 2014