|
THE AMBIGUITY DIAGRAM |
|
|
|
|
|
|
|
|
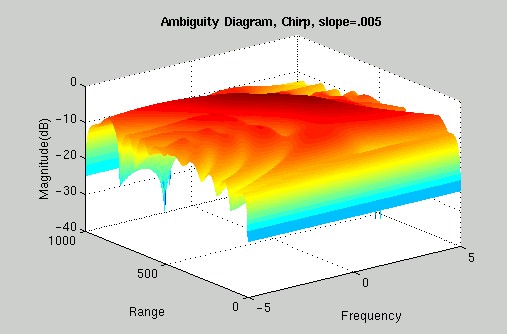
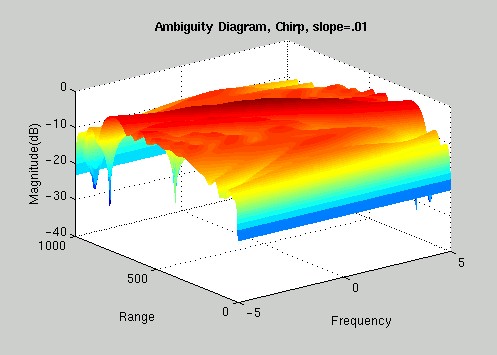
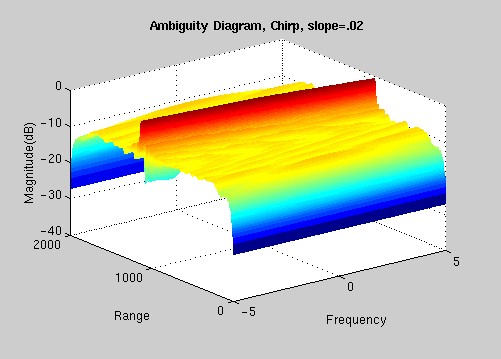
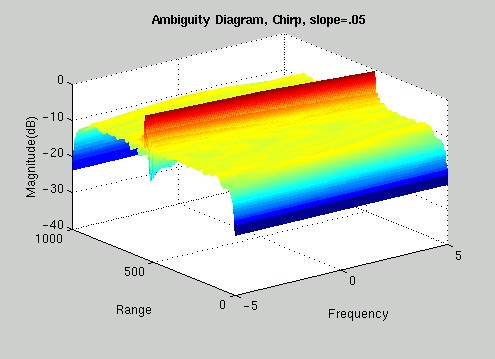
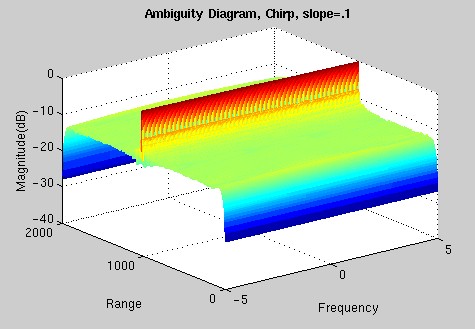
Since you can create various chirp waveforms by adjusting the rate at which the frequency increases (the slope), we decided to take a closer look in order to see how the slope of our chirp affects its properties. The Chirp waveform is very important to certain radar applications and has many benefits. For one, it is easier to produce than a pulse (CW) because of its finite frequency content. It also has less signal decay than a sinusoidal carrier, which makes it easier to detect. The following Ambiguity diagrams demonstrate the effect of increasing the slope of a chirp signal: 1=low slope, narrow bandwidth 5 =higher slope, larger bandwidth
THE VERDICT: We can definitely see a change occurring in the Ambiguity diagrams as we increase the slope of the chirp signal. These graphs indicate that at lower slopes these waveforms do a good job of detecting the speed of an object, but not such a good job at determining the range of the object. However, as we increase the slope of our chirp, it is very apparent that the chirp waveform does a very good job of detecting the range resolution, but not as good a job of detecting frequency resolution. ^ back to top ^ |
MOTIVATION – Why this is important OBJECTIVE – What we hoped to achieve AMBIGUITY DIAGRAM - What it is AMBIGUITY DIAGRAM - How to read it WAVEFORMS – The signals we analyzed RESULTS – Results for CW and PCM CHIRP - A closer look POSSIBLE EXTENTIONS – What’s next CODE - Fascinating stuff ACKNOWLEDGMENTS - Who we have to thank |