|
THE AMBIGUITY DIAGRAM |
|
|
|
|
|
|
|
|
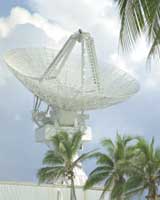
RADAR is a useful technique for pinpointing the location and speed of a distant object. There exist many cases in life where it would prove useful to know this information about something. One such example involves the national security of our country. If for some reason a missile was launched toward our country, it would obviously be helpful to know the exact location and speed of that missile in order to intercept it and destroy it. Another application of radar, which may not be quite as well received by the public, involves traffic safety. A police officer uses a radar gun in order to determine the speed at which your vehicle is moving. That’s how they know exactly how much to make out your ticket for. So how does RADAR work? A RADAR sends out a waveform towards a target. That waveform is then reflected off the object and sent back to the RADAR. This reflected waveform is what we use to tell us information about the object we are observing. For example, when you send out a given waveform, you expect to get back a waveform of the same form. However, because the object is moving, the frequency content of our return waveform will be affected due to what is called the Doppler effect. Most RADAR devices are capable of transmitting many different types of waveforms. Certain types of waveforms are better suited for detecting how fast an object is traveling, while others are better at detecting the range resolution of an object. Range resolution refers to the specific location of an object in space. In the case of national defense, we would like to use a waveform that could predict both range and frequency resolution fairly well. In other cases, such as a police officer using a RADAR gun, we are more concerned with the frequency resolution of a waveform, because this is the information we use to tell us how fast an object is traveling. Our objective in doing this project was to find a way to determine which types of waveforms are best for measuring frequency and range information. ^ back to top ^ |
MOTIVATION – Why this is important OBJECTIVE – What we hoped to achieve AMBIGUITY DIAGRAM - What it is AMBIGUITY DIAGRAM - How to read it WAVEFORMS – The signals we analyzed RESULTS – Results for CW and PCM CHIRP - A closer look POSSIBLE EXTENTIONS – What’s next CODE - Fascinating stuff ACKNOWLEDGMENTS - Who we have to thank
|