|
THE AMBIGUITY DIAGRAM |
|
|
|
|
|
|
|
|
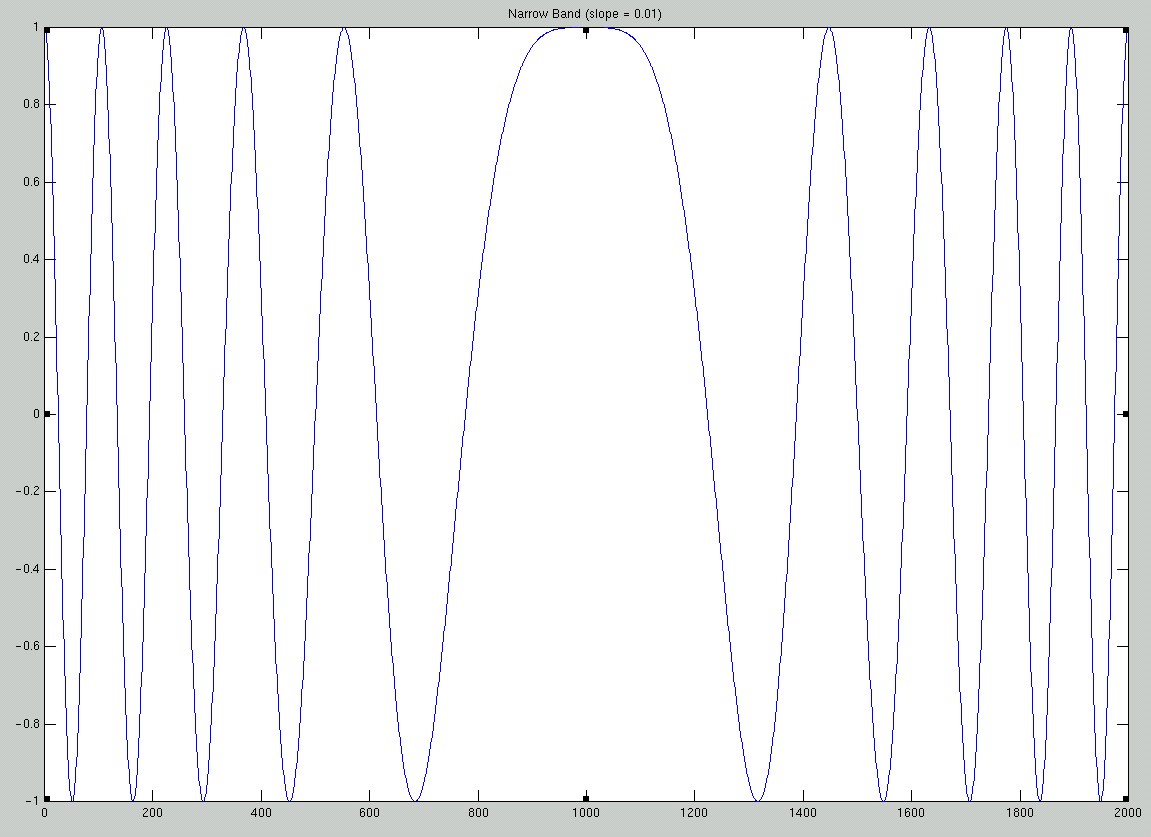
THE WAVEFORMS: We decided to apply the Ambiguity diagram to three different waveforms in order to better understand each waveform’s range and Doppler properties. The first waveform is called the chirp waveform. Basically it is just a linear frequency modulation where we apply a certain slope to the frequency of the sinusoid. Chirp Waveform:
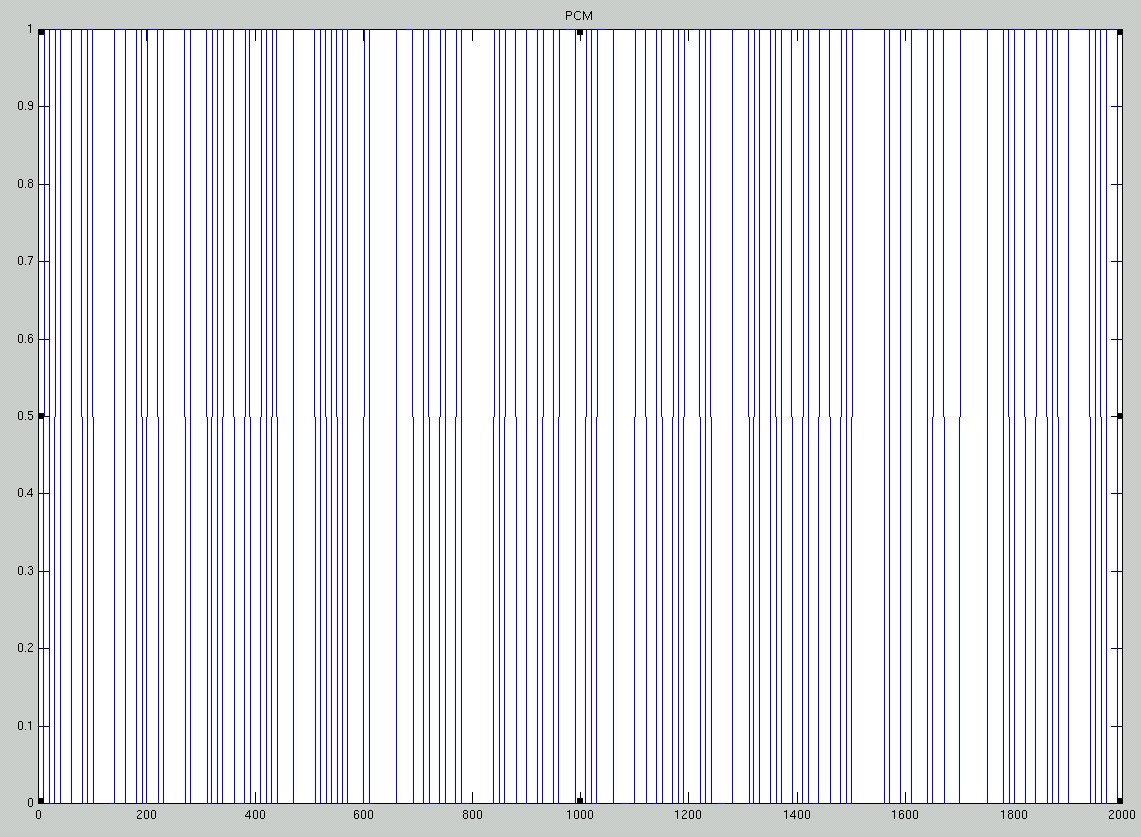
The second waveform is called the PCM waveform, which stands for Psuedo-Random Phase-Coded Modulation. It is a randomly generated sequence of ones and zeros. PCM Waveform:
The third waveform we tested is called the CW waveform. It is simply a constant pulse. ^ back to top ^ |
MOTIVATION – Why this is important OBJECTIVE – What we hoped to achieve AMBIGUITY DIAGRAM - What it is AMBIGUITY DIAGRAM - How to read it WAVEFORMS – The signals we analyzed RESULTS – Results for CW and PCM CHIRP - A closer look POSSIBLE EXTENTIONS – What’s next CODE - Fascinating stuff ACKNOWLEDGMENTS - Who we have to thank |