|
THE AMBIGUITY DIAGRAM |
|
|
|
|
|
|
|
|
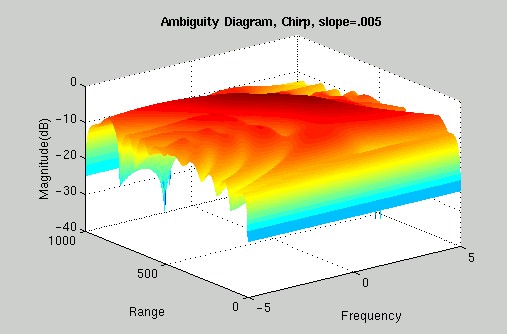
An Ambiguity diagram portrays two important properties of a waveform. It gives us information about a waveform’s range resolution and it gives us information about the waveform’s Doppler resolution. By looking at an Ambiguity diagram, we can tell how well suited a waveform is at telling us the location and speed of an object. FREQUENCY RESOLUTION: As shown in the picture above, one of the horizontal axes of the diagram is labeled frequency. This represents the frequency shifts that were applied to our matched filter. The vertical axis represents magnitude in decibels. As expected, our largest value results from convolution with the signal with zero frequency shift, because it is at this point that we are simply convolving the reference signal with itself. In order to look at frequency alone, simply take a cross-section of the ambiguity diagram at a fixed range. If a waveform is able to detect small changes in frequency (Doppler shifts), then we would expect the Ambiguity diagram to display a high value at frequency zero and low values everywhere else. If there existed relatively large magnitudes for frequencies other than zero, then we would have trouble distinguishing between different frequency-shifted signals. We would therefore not be able to accurately pinpoint the frequency shift that resulted from our return waveform. This would indicate that this particular waveform was ill suited to telling us the speed of the object we are observing. So if we desire good frequency resolution, we must choose a waveform that causes magnitude to fall off quickly as frequency shifts away from zero. RANGE RESOLUTION: The other horizontal axis
is labeled range. Looking at a cross-section of the Ambiguity diagram given a
fixed frequency will allow you to focus on the range resolution for each of
the different frequency-shifted signals. If the only large value resulting
from our convolution occurred at the point where the two signals exactly
overlapped, then we would know fairly accurately the distance to our object. However,
if there existed many large values, then we would not be able to accurately
determine the properties of the returning waveform and therefore would not be
able to tell exactly where our object was. Therefore, in order for a waveform
to have good range resolution, the Ambiguity diagram must display a high
value at the location of the waveform and nowhere else. ^ back to top ^ |
MOTIVATION – Why this is important OBJECTIVE – What we hoped to achieve AMBIGUITY DIAGRAM - What it is AMBIGUITY DIAGRAM - How to read it WAVEFORMS
– The signals we analyzed RESULTS – Results for CW and PCM CHIRP - A closer look POSSIBLE EXTENTIONS – What’s next CODE - Fascinating stuff ACKNOWLEDGMENTS - Who we have to thank |