|
THE AMBIGUITY DIAGRAM |
|
|
|
|
|
|
|
|
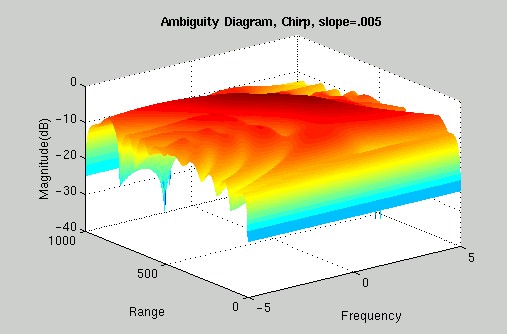
Our goal in this project was to demonstrate how convolution and matched filtering can be combined to produce what are called Ambiguity diagrams. These Ambiguity diagrams can be used as a way to understand a waveform’s range and Doppler properties. Along the way, we hoped to get an idea of which types of signals lend themselves most readily to certain processes, and to explain how these results apply to real life RADAR systems. Example of an Ambiguity Diagram:
^ back to top ^ |
MOTIVATION – Why this is important OBJECTIVE – What we hoped to achieve AMBIGUITY DIAGRAM - What it is AMBIGUITY DIAGRAM - How to read it WAVEFORMS – The signals we analyzed RESULTS – Results for CW and PCM CHIRP - A closer look POSSIBLE EXTENTIONS – What’s next CODE - Fascinating stuff ACKNOWLEDGMENTS - Who we have to thank |