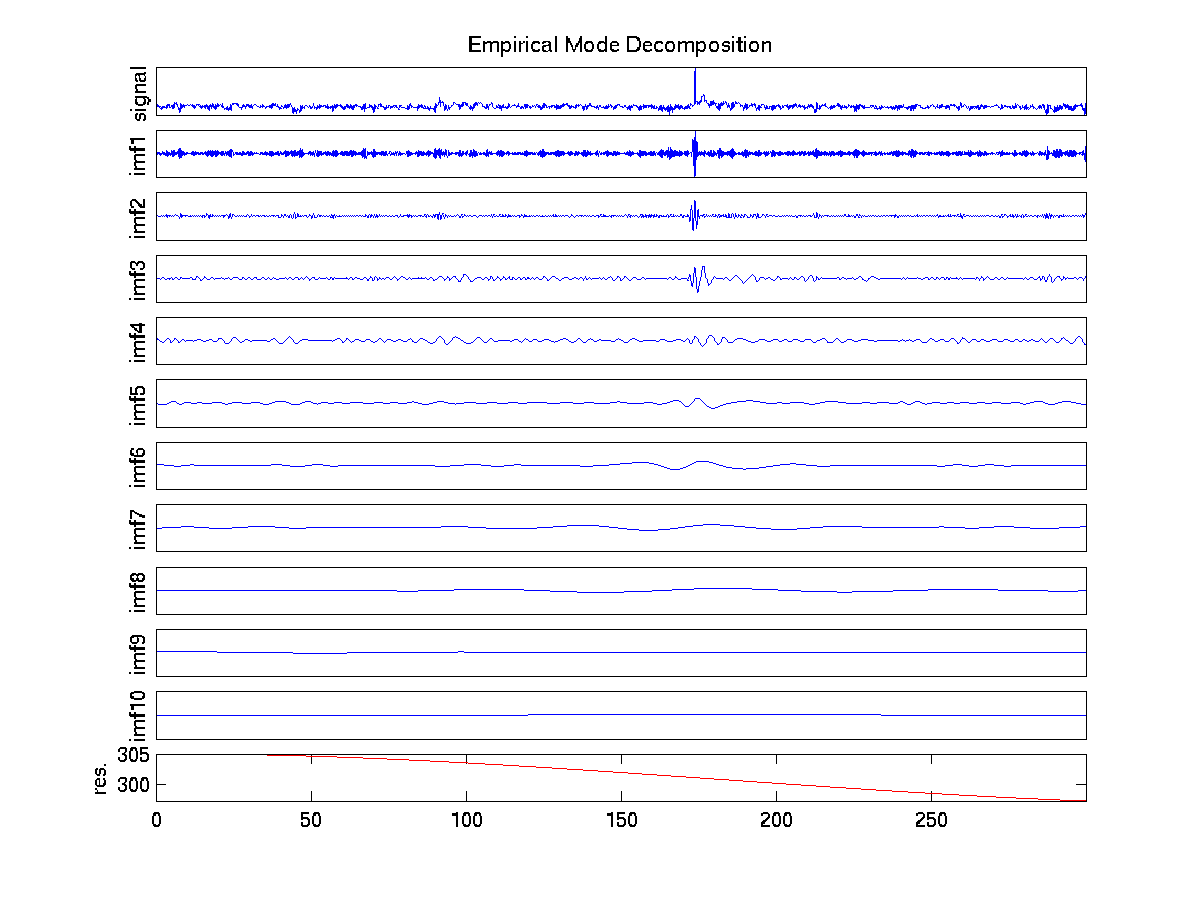
was the algorithm that we spent the most time on, and had the most success with. We feel confident that we are integrating the algorithm into our flow correctly, because the results obtain correlate approximately with those given in a normal heart rate variability plot for mice. EMD works by breaking the signal down into components, called modes, that represent the signal more in the time domain. The difference is found between the signal and all of hte previous modes, and this signal is used to compute the next mode. This process is repeated until the limit of precision of the computer is reached. A typical plot of the modes for a variability study are shown below.
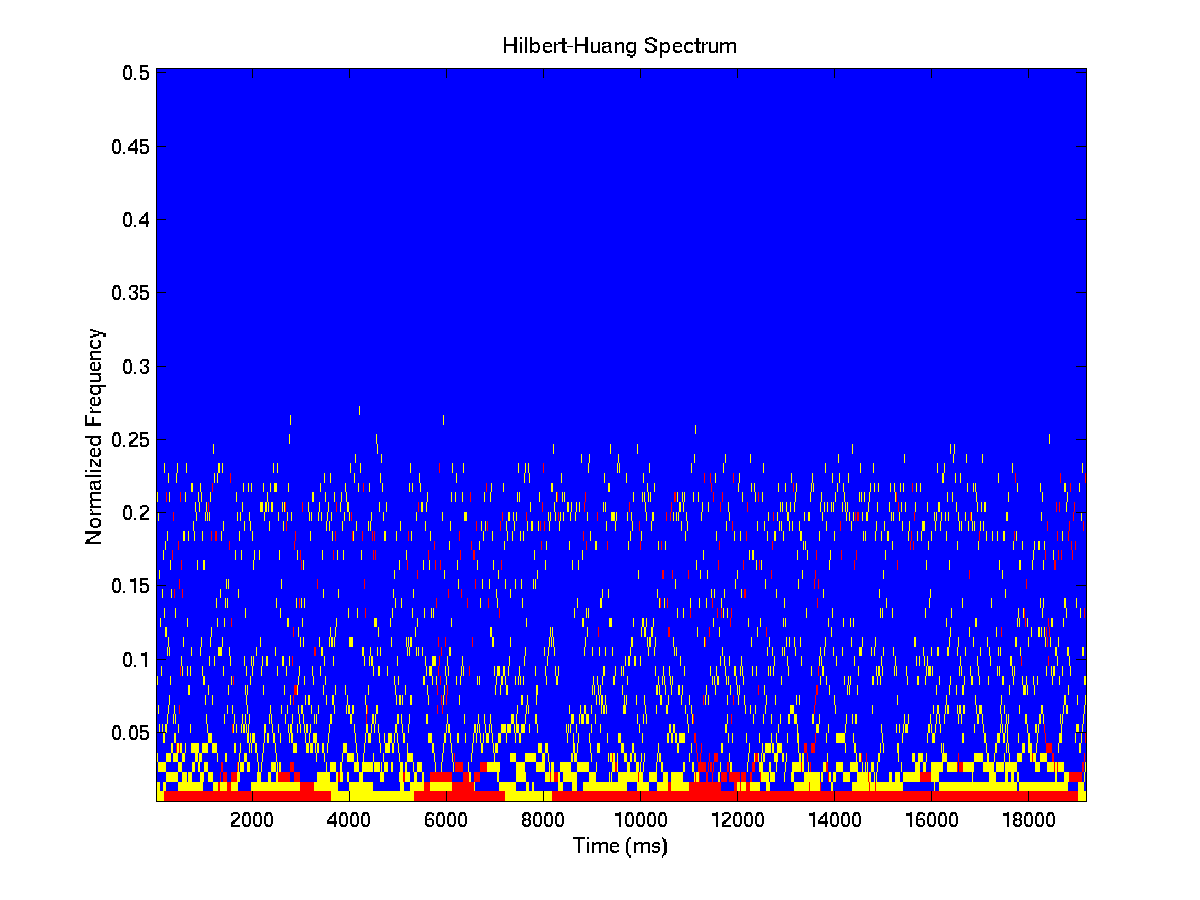
These modes allows instantaneous frequency content to be found in a signal. This results in a spectrogram plot such as that shown below. EMD is better than the smoother pseudo wigner ville in how much finer both the frequency and time resolution are.
However, this fineness of the resolution makes it hard to observe overall trends in the signal through time. An easy way to view this is by creating a partial spectrum, which is the integral of each frequency intensity over the duration of this experiment. This is plotted against frequency as shown below, and gives the characteristic spectra of mice.
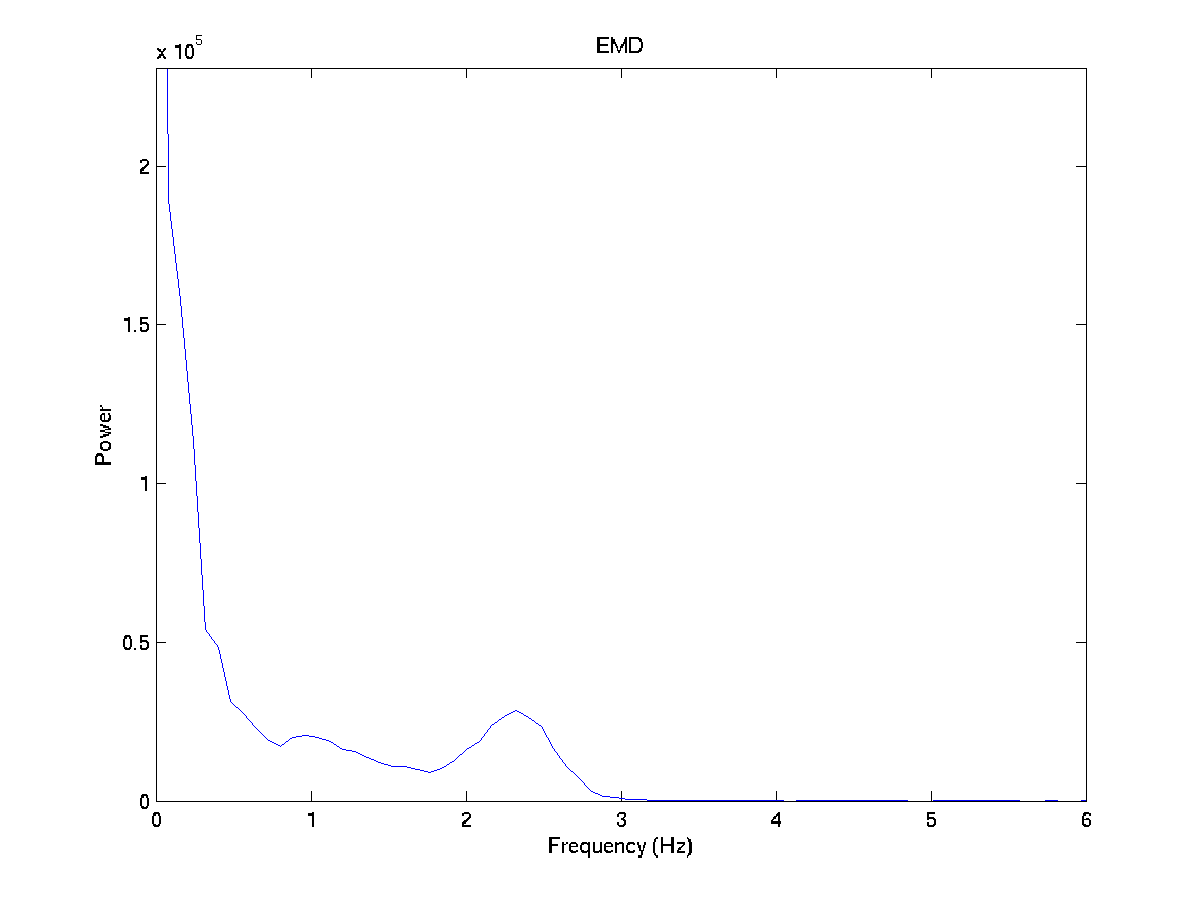
Overall, EMD is a very effective algorithm that allows for good frequency resolution, but results in a smoother spectra that simple FFT analysis.